ADVERTISEMENTS:
The below mentioned article will highlight the experiments on imbibition and osmotic phenomena.
A. Imbibition:
I. Weigh out three lots of 10 or more seeds (maize, gram, etc.) and cover them with water and with 7’5% and 30% NaCl and also 5% sucrose solutions for 24-72 hours.
Determine the percentage of imbibition of liquid by different seeds by weighing.
ADVERTISEMENTS:
II. Place about 2 g of dry starch in a small beaker. Add water gently and stir carefully with a thermometer. Note that there is a rise in temperature due to imbibition of water by starch—imbibition means performance of work and release of energy.
III. Tightly pack gram or any other dry seed in a thin glass bottle of a test-tube. Add a little water. Seal with paraffin and leave it overnight. The bottle is seen to burst due to the imbibitional pressure of the seeds on the glass wall.
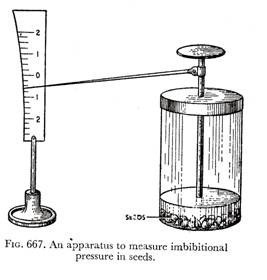
IV. A simple apparatus to demonstrate imbibitional phenomenon in seeds is shown here (Fig. 667). Due to pressure exerted by the swollen seeds on the flat disc which just covers them up, the pointer attached at right angles to the vertical rod connecting the disc, moves up and down along a graduated curved scale.
At the beginning of the experiment, the pointer may be fixed at zero point on the scale, and any movement of the pointer may be read off from the graduated scale, indicating a measure of imbibitional force of the swollen seeds.
B. Osmosis and Osmotic Phenomena:
I. Osmosis as a Physical Process—Experiment with Artificial Membrane:
An artificial osmotic chamber whose walls are made of either collodion (solution of cellulose nitrate in a mixture of ether and alcohol) or parchment containing a strong solution of sucrose is immersed in a vessel containing pure water and a mercury manometer is attached to it as shown in Fig. 668.
All connections are made air-tight and the level of mercury in the vertical manometer tube is noted. After a few hours, the rise of level of mercury in the manometer tube due to inward diffusion of water into the chamber indicates the magnitude of osmotic pressure of the sucrose solution contained in the chamber.
II. Experiment with Semipermeable Membrane of an Egg—Egg Osmoscope:
A small hole is made in one end of an egg and the inner contents are taken out. The semipermeable membrane is then obtained by dissolving about a third of white calcareous shell of the egg very carefully with concentrated HCl and bringing out the soft inner membrane.
Proper precautions and care must be taken so that the inner membrane (which is semipermeable) is not in any way injured. Wash the egg and the exposed membrane thoroughly in water and then attach and seal with sealing was a narrow tube through the hole. The tube should go some distance inside the now empty egg but must not touch the membrane.
Now, through the tube, the egg with its membranous sac is filled with strong sucrose solution and also up to a certain height in the glass tube which is noted. The whole thing is then put into a beaker of water and clamped to a vertical stand (Fig. 669). After some time, the level of liquid in the glass tube is seen to rise due to endosmosis of water through the semipermeable egg membrane.
III. Osmosis in Living Plant Cells—Potato Tuber Osmoscope:
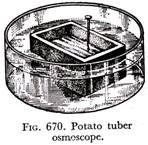
A large potato tuber is taken and its skin is removed. Slice off portions from all sides to make it a flat rectangle. Now the central flesh is scooped out carefully with a knife or a scalpel to obtain a clean deep hollow cavity, taking care not to pierce completely through the sides and bottom, as shown in Fig. 670.
The cup-like cavity is now half-filled with strong sucrose solution and the level of the solution inside is marked with a pin. The cup is now put into a Petri- dish containing water, whose level reaches nearly to the rim of the osmoscope. Within a short time, the level of solution in the cavity is seen to rise due to increase in volume.
ADVERTISEMENTS:
This is certainly due to diffusion of water from the Petridish towards the solution inside the cup by cell-to-cell osmosis—through multicellular, semipermeable membranes.
IV. Plasmolysis
(a) Peel thin strips of tissue from the lower, coloured epidermis of Rheo leaf or any other leaf of flower petals with coloured cell sap. Examine under the microscope and note that the epidermal cells are filled with pink-coloured cell sap.
The thin strips are now covered with a cover glass and are irrigated with strong sugar solution, about 0.5-1 M. Note the effect after a few minutes on the coloured cell sap and observe the plasmolysis patterns. The patterns developed by shrinking protoplasm appear to be specific for each kind of cell (Fig. 665).
ADVERTISEMENTS:
(b) Treat some Spirogyra filaments with 50-70% of methyl alcohol. Observe the bursting of the filament cell walls and the gradual emergence of the protoplast together with the chloroplastids.
V. Demonstration of the Living Nature of the Protoplasmic Membrane:
Semipermeable nature of the living protoplasmic membrane is destroyed by :
(a) high temperature, (b) high concentration of solutes and by (c) toxic substances, e.g., CuSO4, HgCl2, alcohol, etc.
(a) Cut a number of pieces of beet root about 2 cm/1 cm/0.25 cm of about the same size. Wash them thoroughly in tap water to remove all traces of red colour from the injured cut surfaces (injury destroys the semipermeable characteristics of the plasma membrane).
(i) Take several test-tubes containing water at temperatures of 25°, 30°, 35°, 40′, 45°, 50°, 55°, 60°, 70°C. And put a slice of beet root in each test-tube. Stir the slices thoroughly in their tubes and note any excretion of colour from the slices into the water of the test-tubes.
ADVERTISEMENTS:
After about 15 min. note the temperature at which the colour comes into the water. This is the lethal temperature for protoplasm (thermal death point)—indicating that the semipermeable nature of the cell membrane is destroyed at that temperature.
(ii) Mount a few filaments of Spirogyra in water on a slide and heat one end of the slide carefully over a Bunsen flame. Examine under microscope and note any change in the appearance of the cell.
Heating kills the living plasma membrane and with the loss of water from the cell, there is drastic plasmolysis. Dip the filaments again in water and examine under microscope. There is no deplasmolysis and the cells do not revive, showing irreversible changes in the protoplasm brought about by high temperature, again proving the living nature of the membrane.
(b) Keep some Spirogyra filaments in a very strong solution of sucrose, say about 2 M for about 15 minutes. Examine under microscope and observe pronounced plasmolysis of the cells. If these plasmolysed cells are now taken out and put in pure water in Petridish the cells do not revive (there is no deplasmolysis) showing irreversible injury to the protoplasm constituting the plasma membrane.
ADVERTISEMENTS:
(c) Take two slices of beet root and dip them in two test-tubes containing (i) 0.01 N CuSO4 and (ii) 2 M ethyl alcohol. After about an hour, note the excretion of red colour from the slices into the test-tubes. The permeability of the protoplasmic membrane is increased to a point that is injurious to it, leading to its ultimate destruction.
(d) Take epidermal peelings from leaves of any suitable plant. Put the peelings into a solution of dilute methylene blue- (or neutral red) and observe under the microscope the diffusion of the dye into the cell sap, staining it blue or red. Living cells, when killed or non-living cells never show this type of staining.
VI. Determination of Osmotic Pressure of Integrated Plant Tissues—By Plasmolytic Method:
Soak epidermal peelings from the coloured undersurface of leaves of Rheo or any other tissue with coloured cell sap in Petridishes containing solutions of sucrose of different concentrations, ranging from 0.05 M to about 0.30 M. Make about six to seven gradations of solutions within the desired range and after about an hour examine the strips under microscope.
ADVERTISEMENTS:
Count the number of cells plasmolysed in the field (degree of plasmolysis need not be taken into account) at different concentrations used and plot the percentage of cells plasmolysed in different concentrations against sugar concentration on a graph paper. Estimate the concentration of sugar corresponding to the 50% of the cells plasmolysed.
This concentration of sugar can be approximately taken as, equivalent to the osmotic concentration of the cell sap. The corresponding osmotic pressure can be easily obtained (1 M=22.4 atm. at N.T.P.). Desired corrections could be made for the experimental temperatures.
ADVERTISEMENTS:
If osmotic pressure determination is desired for individual cells, it might be done simply by observing the point of incipient plasmolysis and the corresponding concentration of external solution.
In practice, however, it is very difficult to know exactly the point at which the shrinkage of protoplasm has just started at the corners. It may be better if a concentration is found at which there is just plasmolysis and one at which there is none.
As for example, if a cell shows plasmolysis say at a conc. of 0.26 M and no plasmolysis whatsoever at 0.24 M, the concentration at incipient plasmolysis then must lie between 0.26 and 0’24 M, i.e., 0.25 M.
VII. Determination of Mean Suction Pressure (Diffusion Pressure Deficit, DPD) of Cells:
Divide a beet root or potato transversely into slices 2.5 to 3 cm thick. With a cork borer cut vertical borings from both outer and central zones (2-3 cm in diameter) and divide into 5 similar samples of about 5 g each.
Weigh the samples quickly and immerse one sample in each of several gradations of sucrose solutions from 0.1 to 0.5 M in labelled specimen tubes. Leave for about an hour, blot, dry and reweigh.
Plot the percentage change in weight, either increase or decrease against sugar concentration and find out the concentration of sucrose corresponding to zero change. Calculate the suction pressure of the tissue from molar concentration-osmotic pressure standard table and make temperature corrections.
ADVERTISEMENTS:
It may be mentioned here that if cylinders of tissues of either beet root or potato are worked with the same determinations could be made if instead of weight, percentage increase or decrease in length or volume are taken into consideration.
The critical point of determination is the concentration of the external solution with which the tissue comes into equilibrium without any change in the volume of the cell.
VIII. Determination of Temperature Coefficient of Water Absorption by Plant Tissues:
Take three similar samples of about 5 g each of discs (about 2.5 cm to 3 cm thick and 2-3 cm in diameter) of potato tuber, cut out from both outer and central zones.
After correctly noting their fresh weights, put them in three beakers of water (with a thermometer in each) maintained at different temperatures:
(a) At room temperature, (b) at 10°C. or so above room temperature and (c) at approximately 10°C. below room temperature. The temperatures are maintained at the required levels by adding hot or cold water as needed.
After about an hour, take the weights of the disc-samples at different temperature after carefully blotting them to remove all adhering waiter. The difference between the first and second weighing is the measure of the amount of water absorbed by the tissue samples.
Calculate the results as percentages of original weight and determine the temperature coefficient (Q10) of water absorption.


