ADVERTISEMENTS:
After reading this article you will learn about:- 1. Determination of Recombination Value from the F2 Data 2. Determination of Recombination Value from Backcross (Testcross) Data.
Determination of Recombination Value from the F2 Data:
Four methods are available to estimate recombination value from the F2 data. For each of these methods, the F2 data given earlier to detect linkage is used.
Square Root Method:
ADVERTISEMENTS:
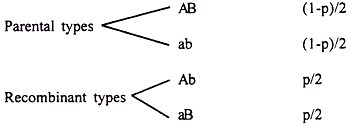
This is a simpler method which does not need complicated formulae and tables. In addition, it is useful in many cases where gene interaction is involved. In coupling phase data, the parental and recombinant gametes are as given below along with frequencies assuming recombination value p.
The frequency of double recessive homozygote (DRH) with the genotypes aabb will be (1-p/2)2. Therefore,
In repulsion phase, the frequencies are reversed. Accordingly,
Square root method utilizes only one F2 phenotypic class and therefore, is less reliable method than other methods.
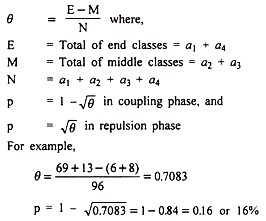
Emerson’s Method:
It was given by Emerson in 1916.
Product Ratio Method:
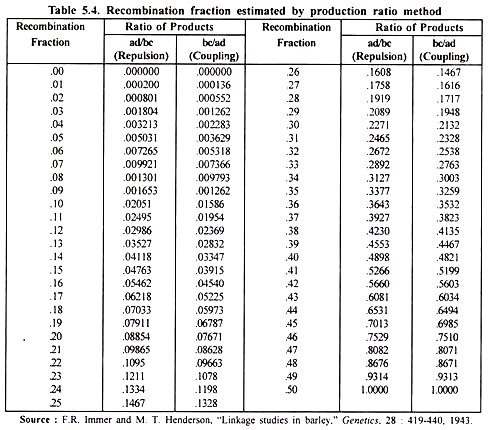
This method originally proposed by Fisher and Bal mukand (1928) has been found to be efficient and is widely used. The ratio of product of crossover to that of parental types, called the product ratio, is a function of recombination.
Recombination value represented by the value of product ratio (X) is directly read from a product ratio value (Table 5.4). This table has been adapted from Stansfield (1969).
Table 5.4 shows that under coupling phase p value corresponding to X = 0.0535, is close to 0.17 or 17%. Product ratio method utilizes all the 4 phenotypic classes and not just the DRH as in square root method. Therefore, this should yield more accurate estimates of p than square root method.
Maximum Likelihood Method:
This method was originally proposed by Haldane (1919).
ADVERTISEMENTS:
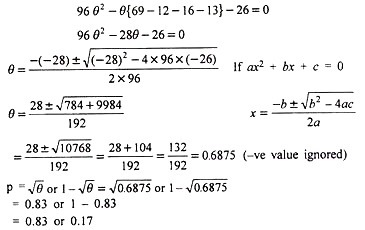
In brief, in this method value of θ is calculated by solving a quadratic equation as:
0.83 being more than 0.50 (the upper limit of recombination value ) is rejected and hence p = .17 or 17%. The comparison of results on p in the above 4 methods shows that except square root method, all other 3 methods have given almost similar results. It is also clear that the product method which is as efficient as the maximum likelihood one for calculating linkage intensities is relatively simple and straightforward when appropriate table is available.
ADVERTISEMENTS:
Unlike the product method which is limited to F2 data where 4-class segregations occur, square root method which is relatively less precise but simple, can be applied to all cases involving 2-, 3-, 4-, 6-, and 9- class segregations regardless whether gene interaction occurs or not provided the double recessive and other phenotypes are each determined by one particular genotype.
Like the product and maximum likelihood methods, the square root method cannot be used to estimate recombination values when the frequency of the double recessive or equivalent phenotype is zero. In such cases one must resort to analysis of F3 results. As a matter of fact the value of θ itself is indicative of close linkage.
Thus, although the square root method does not have as general an applicability as the maximum likelihood method, it can be used in a greater variety of cases than the product method. Neither the square root nor the other 3 methods can be used to calculate percent recombination and linkage values from F2 data for sex-linked genes and autosomal genes if there is no crossing over in meiocytes of either or both sexes.
Determination of Recombination Value from Backcross (Testcross) Data:
For example, in the given numerical values in detection of linkage through backcross data earlier,
ADVERTISEMENTS:
p = 9 + 12/100 = 21/100 = 0.21 or 21%


