ADVERTISEMENTS:
Forest management is a universal and ancient human activity.
However, it was only until UNCED—Earth Summit (Rio-de Janerio, Brazil, 1992) that a large number of participating commonly perceived the need for and the concept of Sustainable Forest Management (SFM).
Forest health and efforts taken either by the government or by the community is how to increase the forest productivity. The main emphasis and the major issue are concerned with forest cover and associated factors pertaining to enhancing the quality of forest products and productivity.
ADVERTISEMENTS:
For the ecological sustainability the forest health plays key role in sustaining the livelihood options and economic sustainability of the peoples living in the forest fringe areas or living in the adjoining regions. Tropical forests are vital for social, economic and ecological reasons.
They play an important role in ecosystem processes (such as biogeochemical and hydrological cycles), they provide habitat for wildlife and serve as source of biodiversity, and they offer protection against soil erosion (Kermen et al., 2000; Sala et al., 2000; Pandey, 2001). In this era of global warming (Forest et al., 2002), tropical forest help mitigate the effects of climate change (Phillips et al., 1998; Schimel et al., 2001) and maintain biodiversity and ecosystem functioning.
Study conducted by Sankar et al. (2000) has tested and developed criteria and indicators for sustainable management of Tropical Plantation Forests in India. The Report finds out the relevance of eight set of criteria and 43 indicators in context of sustainable plantation.
Singh and Singh (2006) found that there was an impact of joint forest management on ecological sustainability and suggested measures to tackle down the issues hindering ecological sustainability in the study area. The important issues were related to incidences of forest fire, grazing, encroachment etc.
ADVERTISEMENTS:
In another study, Singh and Singh (2006) found that participation of community member in controlling fire grazing, encroachment etc., is significant and the permanent pasture grazing land has increased. Thus, it becomes essential to study and test the selected variables in the surplus water resource and deficit water resource region and its impact on the forest health and forest productivity in the study area.
The following are the objectives of this paper:
Objectives:
1. Identification of surplus and deficit water resource region.
2. To study the forest health, forest covers and forest productivity in the water surplus and deficit regions in the study area.
3. To assess the impact of water resources on permanent pastures, grazing land and status on land put to other uses in the study area.
4. To compare the collection of forest products and associated variables in the water surplus and water deficit region and its impact on economic condition of people.
5. To suggest on the basis of facts and findings.
Methodology:
ADVERTISEMENTS:
The present study is a field based one therefore qualitative and quantitative assessment was done during the intensive village survey of Jhabua and Mandla district from Madhya Pradesh state. Both primary and secondary data was used in this paper.
Primary source of data is collected by using ecological quadrate method in which 10 X 10 m of plots were laid down in the selected Forest Protection Committees (FPCs) and Village Forest Committees (VFCs) in study area of Jhabua and Mandla district of Madhya Pradesh, to assess the tree density in the survey area.
Categorization of Water Surplus and Water Deficit Region:
In the present study, based on the average annual precipitation received in the region are the criteria for the demarcation of water deficit and water surplus region. Based on the average annual rainfall Jhabua district is selected as deficit water resource region and Mandla district as surplus water resource region.
ADVERTISEMENTS:
The second criteria was based on the number of existing water bodies, availability of water resources in number of months and throughout the year in major/tributaries of Narmada River of Madhya Pradesh. Comparative analysis was made for the selected attributes, to find out the changes in two districts in the condition of forest, Non-Timber Forest Production (NTFP) collection, income, population, cattle population and changes in the land used pattern in the study area.
Variables and Indicators Used in the Study:
Eight variables and indicators were used in the study to meet with the objectives. These variables are related to changes in the forest area, population, rainfall, land use pattern, changes in level of peoples’ participation in forest conservation, protection and development and changes in per capita forest area.
The Study Area:
ADVERTISEMENTS:
Jhabua district lies between 21°55′ to 23°15′ North latitudes and 74°2′ to 75°12′ East longitudes. The district is located on the south-western border of Madhya Pradesh and forms the core of western tribal belt of India. The total geographical area of the district is 6,782 sq km; which constitute 1.5 per cent of total area of the state.
The details of the selected forest ranges and VFCs from Jhabua and Mandla districts were given in Table 16.
Mandla district is situated on the east-central part of the state and lies between 22°12′ to 23°11′ North latitudes and 80°18′ to 81°51′ East longitudes. Its extreme length is about 133 km from north to south, and extreme breadth 182 kms from east to west. The tropic of cancer passes through the north of the district.
From the study area four VFCs (25 per cent of the total VFCs) were taken for in-depth analysis from Moti Nala forest range, and one FPC from Mawai Range, division of Mandla district of Madhya Pradesh. The study area, Moti Nala of Mandla district is 170 km from Jabalpur city.
ADVERTISEMENTS:
Mandla district is located near by the brim of Narmada River. Mandla district has good flora coverage, because of good moisture retainment in the soil, good water status. Moti Nala is 75 km from Mandla district. At the time of survey there were 95 VFCs in Mandla district and 16 VFCs in Moti Nala forest division.
Analysis:
Table 1 shows the demarcation of surplus and deficit water resource regions in the study area based on average rainfall, location and catchments areas of rivers.
It is evident from the Table 2 that the geographical area of water surplus region of Mandla district is higher than the water deficit water region in Jhabua district. The average elevation from sea level was recorded highest in Mandla district while the physical appearance of Jhabua district is undulating plateau with steep hilly terrain, eroded slopes and degraded forest.
In water surplus regions of Mandla district, it forms ridge system. It is also evident from the table that the forest cover in surplus water resource region of Mandla district is higher than the deficit water resource region, Jhabua district.
Table 3, indicates the changes in forest cover, in study area of Jhabua and Mandla district. The per capita forest area has slightly changed in Madhya Pradesh due to the formation of Chhattisgarh state, as the total population has now split up into two states, while per capita forest cover in Mandla district has registered a change by 0.003 sq. km due to formation of other district from Mandla territory.
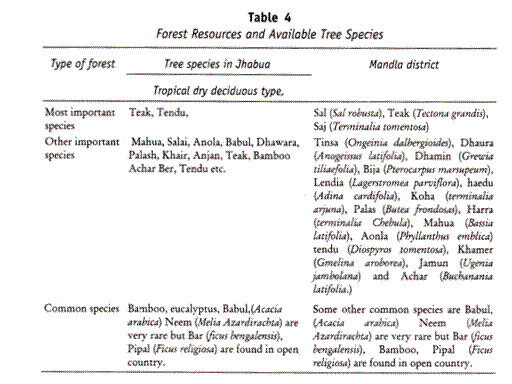
Table 4, reveals the information of forest resources and available tree species in surplus water and deficit water regions. It is evident from the table that in Mandla district most important species, other important species and common species are higher than the Jhabua district.
Table 5, reveals the information of human resource in the Jhabua and Mandla district. In the water deficit area the population was recorded higher as compared to Mandla district. As per Census 2001, it is also clear from the table that 0.13 per cent of population of Madhya Pradesh lives in Jhabua district and 0.08 per cent of population lives in Mandla district. The decadal growth was lower 14.66 per cent in Mandla district, as compared to Jhabua district. The sex ratio Mandla district 1,002 per thousand is higher than national sex ratio.
Status of Pasture and Grazing Land:
ADVERTISEMENTS:
Table 6, shows the depleting permanent pastures and grazing lands. It is evident that the area of permanent pastures and grazing lands was declined during 1985 to 1998-99 in the study area by -1.99 per cent in Jhabua district while -1.78 per cent in Mandla district. In context of Mandla and Balaghat region of Madhya Pradesh the permanent pastures and grazing lands has shown a contracting and declining trends (Singh, 1996). In Madhya Pradesh, it was recorded -0.48 per cent as compared to 1990.
Table 7, shows the status of barren land and unculturable land in the study area. It is evident that the area of barren land and unculturable land had declined during 1985 to 1991-92 in the study area by -4.55 per cent on contrary it has increased in Jhabua district by +0.93 per cent in 1998-99, with a decline of -1.31 per cent in Mandla district. In Madhya Pradesh it was recorded + 4.52 per cent in 1998-99, as compared to 1990.
It is evident from the table that there is a direct positive correlation between water resources. The status of barren land and unculturable land in water deficit region Jhabua is higher than the water surplus region of Mandla district. This proves that there is an impact of availability of surplus water and deficit water on the changing status of barren and unculturable land.
Table 8, shows the status of culturable waste land in the study area. It is clear from the table that the area of culturable waste land has decreased during 1988 to 1998-99 in the study area by -0.24 per cent under the category of ‘A’ column and +2.69 per cent under the category of ‘B’ column in Jhabua district, while -1.68 per cent under the category of A column and -0.17 per cent under the category of B column in Mandla district. In Madhya Pradesh it was recorded -0.15 per cent under the category of A column and -0.88 per cent under the category of B column, in the year of 1998-99 as compared to 1988.
It could be concluded on the basis of Table 6, 7 and 8 that the positive and negative trend in the percentage changes of permanent pastures and grazing land; barren and unculturable land and culturable waste land has increased in per cent area in the land put to non agricultural uses.
The impact of surplus water resource region and deficit water resource region could be viewed in terms of the livestock and animal statistics. The changes occurred during the comparative period of 1985 with the year of 1991-92 indicates that the higher the number of bovine animals is confined to the availability of fodder resource in the water surplus region as compared to water deficit region of Jhabua district.
The livestock and animal statistics (As per 1985 and 1991-1992 year) in the study area shows:
The population of bull and bullocks, cows and others has increased in Jhabua district by 5.06 per cent and decreased by 6.4 per cent in Mandla district. The population of livestock has increased in Madhya Pradesh by 0.89 per cent. In case of the buffalo, she buffalo and others has increased in Jhabua district by 15.19 per cent and decreased by 0.33 per cent in Mandla district. The population of livestock has increased in Madhya Pradesh by 7.4 per cent.
There was increase in the population in the same year of sheep, goats, horse, pigs others in Jhabua district by 20.1 per cent and decrease by 5.59 per cent in Mandla district. The population of livestock has increased in Madhya Pradesh by 1.6.
The livestock population in Jhabua and Madhya Pradesh is increasing. This increasing livestock population has an impact on ecological sustainability in the study area. The per capita availability of permanent pastures and grazing lands in the study area of Jhabua and Mandla district has decreased.
Table 9, shows the per capita availability of permanent pastures and grazing land per thousand cattle. It is clear from the table that per capita area in hectare has decreased in Jhabua and Mandla district respectively, which also indicates increasing pressure on permanent pastures and grazing land.
The per capita area for bull, bullocks cows and others has decreased by 0.0147 ha; for he/she buffalo and others by 0.1354 ha; and for sheep, goats, horse, pigs and other by 0.0639 ha in Jhabua district, while in Mandla district, the per capita area for bull, bullocks cows and others has decreased by 0.0012 ha; For he/she buffalo and others by 0.0262 ha; and for sheep, goats, horse, pigs and other by 0.008 ha. It is evident that reducing per capita area in hectares in future may become an alarming situation.
Above Table also indicates that in the water surplus region of Mandla district the per capita area available to bovine animals is lower as compared to water deficit region of Jhabua district because of good growth and productivity of fodder grass resources per hectare. Whereas such growth and productivity of fodder grass even is not recorded 20 per cent per hectare area in Jhabua district.
Status of Forest Fire and Damages Caused by Forest Fire on Forest Health and Productivity:
For the ecological sustainability the control on forest fires are very important. From the records of forest department there is not a recorded major forest fire. Some of information obtained from the selected VFCs/FPCs in the study area of Jhabua and Mandla district reveals that small fire incidents had taken place. The detail are given in Table 10.
It is clear from the table that incident of forest fire was recorded highest in water deficit region and lowest in Mandla district. Study conducted by Singh et al. (2006) suggested that the incidents of forest fires and damages caused by fire could be controlled through community participation and effective involvement of committee members.
The major reasons of the forest fire is manmade, which generally occurs in the collection period of Non-Timber Forest Products (NTFPs) and Non-Wood Forest Products (NWFPs) by throwing the lighted end tails of Indian rural cigarette (Bidt). Most of fire incidence takes place in the summer season due to high temperature because of combustion (Negi, 2000) which results in low moisture containment.
Impact of Forest Fire:
The impact of forest fire is given Table 10. It is clear from the table that forest fire has destroyed almost 95 per cent of new recruits and regeneration in the 45 and 38 hectares of land in the study area of Jhabua and Mandla district. Another impact of forest fire is seen on the number of trees burnt which were recorded 120 and 150 in the study area.
The impact of forest fire is also seen on less quantity of NTFP collection in the study area of Betul division and how the less quantity of collection has resulted in the monetary loss of Rs 60,000 (Singh et al., 2006). The impact of forest fire is also seen on “not obtaining fuel wood from the effected area”; 92.5 per cent of people have supported this statement. Whereas 87.5 per cent of people responded in favour of that “fodder and grasses are not available till the first rainfall”; on the other hand 80 per cent of people viewed that because of fire the wild animals start disappearing from the effected site and shift to other dense forest patches.
The 42.5 per cent lowest responses were recorded as clears the way in forest because of leaf litters it could be concluded that forest fire is one of the important hindrances in the ecological sustainability. The control of forest fire is essential for ecological sustainability (Artsybashev, 1983; Singh et al, 2006).
Employment Opportunities Provided by the Forest Department in the Study Area:
Table 11, shows the condition of employment in the study area, after Joint Forest Management (JFM) programme. It is evident from the table that in Jhabua district all types of works continued up to 117 days and 90 people have obtained employment as labour in the selected VFCs/FPCs. People’s have generated wages worth of Rs 1.83 lakh.
While all types of the work continued for 170 in Mandla district and 144 people have obtained employment as labour in the selected VFCs/FPCs and people have generated wages worth of Rs 2.35 lakh. The wages earned by the people as labour is higher by Rs 0.492 lakh (20.9%) as compared to Jhabua district. The average income of the people earned from wages in Jhabua district is lower by Rs 433 (20.9%) as compared to Mandla district. It is also evident that after JFM programme, the role of forest department has emerged as key in providing employment opportunities thus keeping a check on the migrants from the district.
Economic Sustainability from Fuel Wood and Pattern of Rural Energy Consumption in the Study Area:
Fuel wood is derived mainly from forest and the key to its production lies in forest policy and management. Earl describes fuel wood as ‘forest energy’ and refers to the ‘forest capital stock’ and ‘forest productivity’. A section of his book Forest Energy and Economic Development is devoted to so-called natural forest types and uses a map of forest types to make an estimate of the renewal and removal of energy stored in the world’s forest resource (Earl, 1975). The FAO report on food and agriculture for 1976 also refers to the cutting of wood from the world’s ‘Forests’ and use of half of it as fuel wood (FAO, 1977a)
Although enough work has been done on rural energy, yet a detailed comprehensive analysis is required to understand the factors which influences the rural energy consumption, such as economic, social, and technical factors, but also agricultural and environmental conditions, which must all be taken into consideration, when supply and demand analysis is required. Thus, assessing economic sustainability of fuel wood is very important in context of rural energy consumption in the study area of Jhabua and Mandla district of Madhya Pradesh.
Fuel Wood Collection by the Households:
Table 12, reveals the attributes related to collection of wood fuel in the study area of Jhabua and Mandla districts of Madhya Pradesh. It could be concluded on the basis of the table that less distance was travelled by the people in the surplus water resource region. The 2 per cent of the households has been reduced in context of wood fuel collection. The gender participation in collection of wood fuel was recorded highest as compared to Jhabua district both in case of male and females.
The weekly and yearly trips were recorded highest in Mandla district. It is also evident from the table that 50 per cent of less time was recorded as average time spent per household in collection of wood fuel. The quantity collected and brought per trip by the household was higher in Mandla district.
The average collection of wood fuel in a year by the sample households recorded was 1,820 quintals by 50 households in the study area. The increase in collection of wood fuel per household also indicates the level of extraction of wood fuel from the forest and if estimated at the market price the annual extraction of wood fuel per household could be assessed in money value.
Table 13, gives the information about the extracted wood fuel by the household in a year from the forest in Rupees, if estimated at the base year price of the local market. It could be concluded from the table that the wood fuel extracted before JFM was Rs 1.35 and 1.82 lakhs in Jhabua and Mandla district of Madhya Pradesh, while the per household earning if estimated was Rs 0.027 and 0.0364 lakh in Jhabua and Mandla district of Madhya Pradesh respectively.
The households earning has increased by Rs 0.3405 and 0.3888 lakh in the study area of Jhabua and Mandla district of Madhya Pradesh. The overall estimation of income has increased by 17.5 per cent. While the per capita income estimated from the removal of wood fuel removal from forest has increased to Rs 0.0345 and Rs. 0.0450 lakh Rs in Jhabua and Mandla district of Madhya Pradesh. The per capita income has increased overall by 20.2 per cent. The estimation of income from the extraction of wood fuel is free to the people.
Fuel Wood Trade:
The forest energy resources include all woody plants that provide fuel. Eight categories may be defined: fuel forests, timber forests, shelter forests, sparse woods, shrub areas, economic forests (excluding timber) homestead gardens and orchards.
Three parts of the tree can be used as fuel; the branches, top of the trunk, and bark of the main trunk. The quantity of fuel wood obtained from each tree depends on its variety. In general, broad leaf trees have more branches and therefore yield more fuel wood than coniferous trees, bark is 10 per cent of the trunk in weight.
Some of the study deals in the trade of wood fuel and its impact on the livelihood of fuel wood seller. Study concluded that alternative rural energy system need to be developed at low or cheap cost so that the withdrawal of wood fuel should be checked and depletion of the forest resources be controlled (Prasad et al., 2001; Bhattacharya et al., 2001).
It could be concluded from Table 14 that 45 per cent of the total earning from the sale of wood fuel comes to their hand in the month of rainy season (because of high prices of wood fuel as compared to other season.) while other 55 per cent of income earned from two other seasons. Average annual income, per household from the sale of wood fuel was recorded highest in the water surplus region of Mandla district as compared to Jhabua district.
Fuel Wood Consumption:
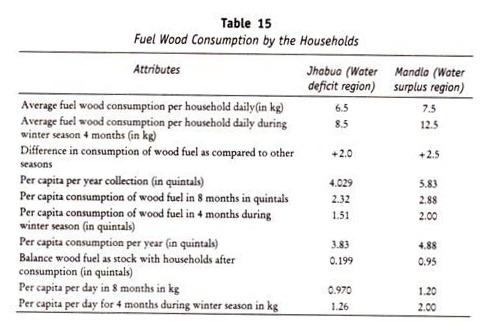
Table 15, shows the fuel wood consumption in the study area of Jhabua and Mandla district of Madhya Pradesh.
It could be concluded that 7.5 kg of wood fuel was consumed by per household in the study area of Mandla district which was recorded higher than the Jhabua district. The per capita per day consumption of wood fuel was 0.970 and 1.20 kg in other seasons or 8 months in Jhabua and Mandla district respectively. The per capita per day consumption of wood fuel was 1.26 and 2.00 kg in winter season or 4 months in Jhabua and Mandla district respectively.
The per year per capita collection and per capita consumption was recorded higher in winter season as compared to other seasons in the water surplus region of Mandla district. The balance wood fuel has been available as stock with households after consumption.
Non-Timber Forest Products or NWFP Non-Wood Forest Products:
The role of Non-Timber Forest Products (NTFPs) is growing globally (Grimes et al., 1994; Perez and Arnold, 1996; Wickens, 1991). However, most of the ‘developing countries’, central policy still categorizes NTFPs as ‘minor’ forest products, resulting in less emphasis upon these products than upon timber within forest management programmes and policies.
Yet NTFPs are frequently the primary motivating factors for local emphasis and underscores contrasting valuation of NTFPs between policy makers and local people. The government have undervalued forest, or focused only on timber, and this has led to clearance or degradation of forests.
NTFPs are seen to be important in three crucial aspects (Arnold and Perez 1996): (a) sustainable use of forests, (b) the livelihood systems of very large numbers of people, and (c) meeting commercial demands. Theoretically, the above three issues are important for any government, and first two should be more important; the practice, however, is contrary.
The third has always been the major concern of many governments in developing countries (Falconer, 1990). Most of the world’s forest is under direct control of governments and the rest is also heavily influenced by government policy (Repetto, 1988) and so government’s value judgments for setting management priorities.
In this context the protection rights of green consumers and redressal of grievances were stressed by (Singh et al., 2006). The quantum and quality of collection of NTFPs varies in Jhabua and Mandla district which has a direct impact on the livelihood and income generation of the people. Taking some threads from the earlier work done by the author, attempts to find the collection, consumption and pricing of NTFP, distance travelled, time taken etc., variables in water surplus and water deficit regions (Singh, 2004).
Collection of NTFPs and Other Forest Products:
Table 16, indicates the changes in collection of NTFPs and other forest products in the study area of Jhabua and Mandla district of Madhya Pradesh.
Valuation of NTFPs and other Forest Products:
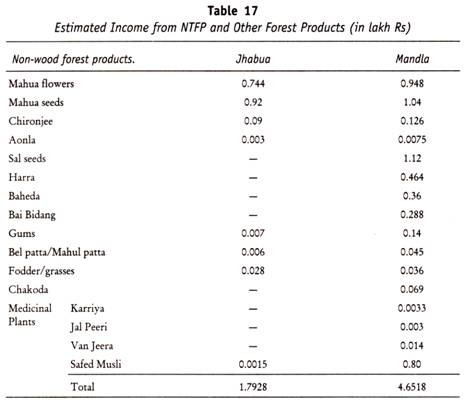
Table 17, shows the estimated income from the collection of NTFPs and other forest products from forest in the study area of Jhabua and Mandla district of Madhya Pradesh. The debate on valuation of nature and the environment, green national accounting and economic growth is a classic and important topic in environmental economics. (Ekko et al., 2001). Discussion on the definition and meaning of national income began at the beginning of the twentieth century with the work of (King, 1919) and Pigou’s famous. The Economics of Welfare (Pigou, 1920).
Fabricant (1947) argued about the depletion of natural resources should be taken into account as a cost component in the system. The debate renewed at the end of the 1960s when serious concerns grew about pollution and the exhaustibility of resources. Especially, Mishan’s classic contribution.
The Cost of Economic Growth (Mishan, 1967) induced a lot of discussion. He also challenges the traditional way to measure welfare or utility through the concept of national income because its failure to include the deterioration of the environment.
The concept of how to make correction in national income, in this regards (Hueting, 1991) argue that the valuation exercises should explicitly account for future generations and their rights on particular environmental services. This suggests that the concept of a sustainable or green national income is also appropriate from a green national product.
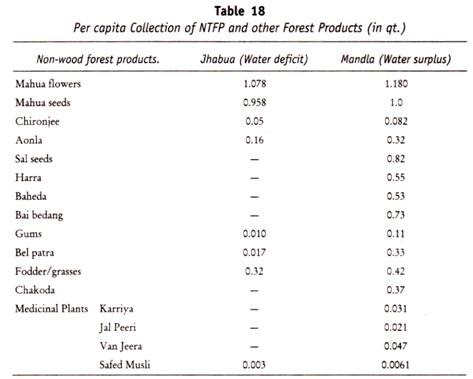
It could be concluded from the table that collection of NTFP and other products from the forests was recorded highest in water surplus region of Mandla district as compared to Jhabua district. Table 18, shows the per capita collection of NTFPs and other forest products in the study area of Jhabua and Mandla district of Madhya Pradesh.
The per capita collection of NTFP was recorded highest in all NTFPs. This increase in per capita collection has a impact on per capita earning of people in the study area of Jhabua and Mandla district of Madhya Pradesh. According to Campbell (1988, cited in Tiwari and Campbell, 1995), small scale forest based enterprises, many of which rely on NWFPs, provide 50 per cent of the income for about 25 per cent of India’s rural labour force.
At national level over 50 per cent of forest revenue and about 70 per cent of forest export revenue comes from NWFPs mostly from unprocessed and raw forms (Tiwari and Campbell, 1997; Prasad, Shukla and Bhatnagar, 1996).
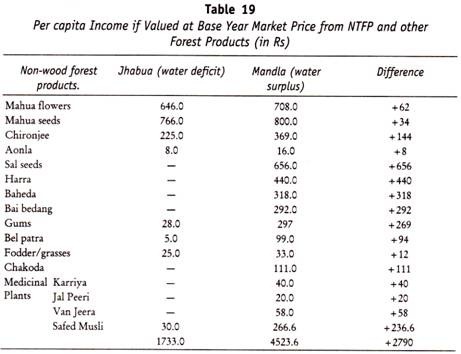
Table 19, shows the per capita income if valued at base year market price from NTFP and other forest products. It is evident from the table that per capita income was recorded highest in NTFPs by more than 2.57 times in water surplus region of Mandla district as compared to water deficit regions.
Pricing of NTFPs and other Forest Products:
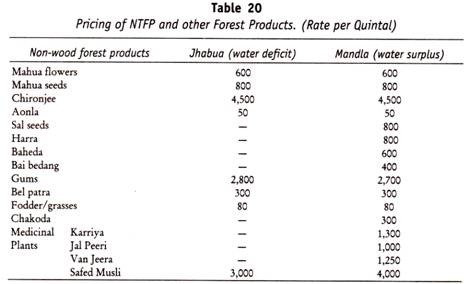
Table 20, shows the price of NTFP and other forest products in the study area of Jhabua and Mandla districts of Madhya Pradesh.
It could be concluded from the table that the prices have increased in the local market of NTFP and other forest products. There is no price variation in the study area before and after JFM programme, on the contrary the price has increased in the same proportion as seen in the districts. The increase in prices per quintal after JFM has economic impact on people’s earning in the study area.
Time, Distance and Mode Factor in NTFPs Collection:
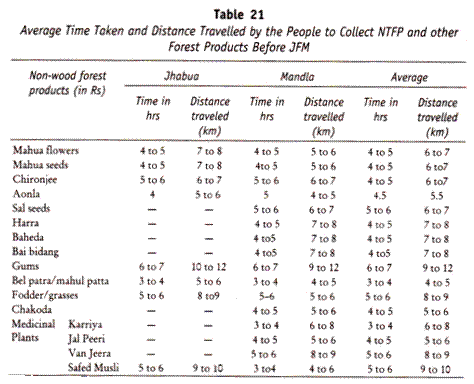
Table 21, reveals the average time taken in hours and distance travelled by the people to collect NTFPs and other forest products.
Time Factor in Hours:
It could be concluded from the table that people were taking less time in hours in collection of NTFPs in Mandla district as compared to Jhabua district. The declining trend of time frame is a good indicator of availability of NTFPs and other forest products in abundance in the water surplus area.
Distance Factor in Kilometres:
It could be concluded from the table that people are travelling in kms to collect NTFPs and other forest products in the study area of Jhabua and Mandla district of Madhya Pradesh. The decline in the distance travelled in km indicates availability of NTFPs and other forest products in forest area in the study area.


