ADVERTISEMENTS:
List of experiments on Respiration are as follows:
Experiment 1:
The Experiment:
ADVERTISEMENTS:
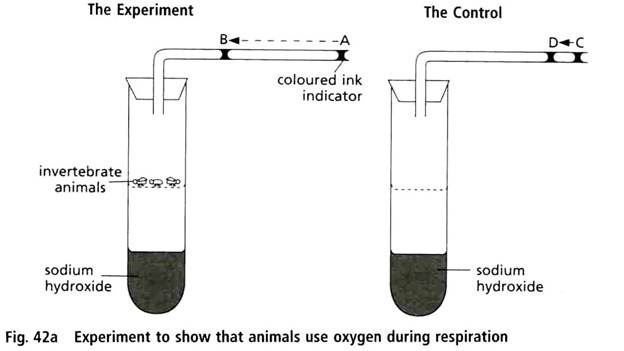
For each molecule of oxygen taken in by the animals, a molecule of carbon dioxide is given out. The molecule dissolves in the sodium hydroxide, decreasing the volume within the apparatus. The indicator thus moves from A to B.
Note:
When all the oxygen in the tube has been used up, the total volume inside the apparatus would have decreased by 20%.
ADVERTISEMENTS:
The Control:
In the same period of time, the only carbon dioxide to dissolve in the sodium hydroxide is that already in the air. The indicator moves only from C to D.
Experiment 2:
Experiment 3:
A. The hydrogen-carbonate indicator remains red, showing that no carbon dioxide is passing on to the next tube.
B. The hydrogen-carbonate indicator changes from red to yellow, showing that carbon dioxide is present. The carbon dioxide is evolved by the respiring peas.
Depending on the need for oxygen in the body (and the need to remove waste carbon dioxide), the rate and depth of breathing may vary.
ADVERTISEMENTS:
More oxygen is used, and more carbon dioxide is released, when we are active. This can be demonstrated in the following way.
Experiment 4:
To Show the Effect of Exercise on the Rate of Breathing:
Count the number of breaths taken in one minute by a person at rest (it is easier to count someone else’s breathing rate than it is to count your own). Do this three times and take an average (around 15 breaths per minute).
ADVERTISEMENTS:
The person should then perform five minutes of exercise as follows:
To Show the Effect of Physical Activity on Pulse Rate:
Method:
The number of pulse beats per minute is counted in a person at rest. This is done three times, and each result is recorded. The average number of pulse beats per minute is calculated.
ADVERTISEMENTS:
About five minutes of exercise is performed (e.g. running, or stepping on and off a stair step).
The number of pulses beats in 10 seconds is counted and recorded. After 20 seconds, the number of beats is again counted over a 10-second period.
The process is continued for 10 minutes.
Each recorded number is multiplied by 6 to obtain the rate per minute.
ADVERTISEMENTS:
The results can be used to draw a graph to show the rate of heartbeat gradually returns to normal after exercise. The fitter the subject, the quicker the pulse rate return to normal.
Count the number of breaths in a 10-second period every 30 seconds for 10 minutes.
Calculate the rate per minute, and plot a graph of breathing rate against time.
Experiment 5:
To Show the Effect of Regular Exercise on the Depth of Breathing:
ADVERTISEMENTS:
Regular exercise can affect the volume of air a person is able to inspire, and then expire, in one deep breath. This can be demonstrated by using the simple respirometer shown below.
Organise a group of athletes and a group of non-athletes to breathe in as far as they can, then breathe out through the rubber tube as far as they can. Measure the volume of water expelled from the container by each person.
Calculate the average volume per person for the athletes, and the average volume for the non- athletes. Compare the results.
Athletes should be able to exhale a greater volume of air (and thus, be able to breathe more deeply).
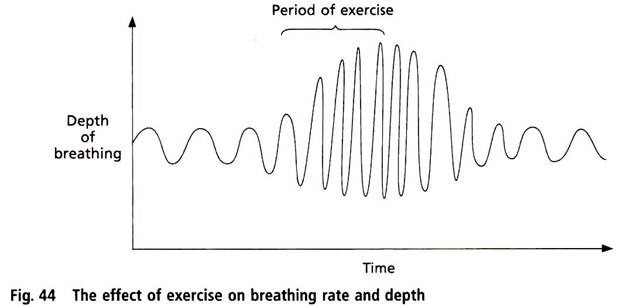
The immediate effect of exercise on the depth of breathing may be successfully demonstrated only with a commercial respirometer. A person breathes in and out through a tube connected to a piece of electronic equipment which measures the depth and the frequency of breathing. The respirometer produces a graph of the results.
ADVERTISEMENTS:
If a person measured the depth and rate of their breathing before a period of exercise, then every 30 seconds after exercise, the results would be similar to the graph shown below.

