ADVERTISEMENTS:
In this article we will discuss about meaning and methods of calculation of Standard Deviation.
Meaning of Standard Deviation:
The best and most important measure of dispersion is standard deviation which was first worked out by Karl Pearson (1833). It is the positive square root of mean of deviations of individual values of a data series from the arithmetic mean of the series.
In other words, the square of standard deviation is equal to mean of the square of deviations of individual observations from the arithmetic mean. It is also called mean square deviation from the mean and is denoted by a Greek symbol σ.
ADVERTISEMENTS:
Let us suppose that n is the total number of observations (Say, X1, X2, X3,X4——————– , Xn) and the sum of the values of all observations is S.
If the values of observed data are equal, the mean deviation will be zero which represents its lowest value. The value of standard deviation will increase with the increase in deviations of individual a from their arithmetic mean. To make the standard deviation comparable, co-efficient of standard nation is calculated which is the ratio between standard deviation of observation series and its
Methods of Calculating Standard Deviation:
Generally, the following three methods are used for calculating standard deviation:
1. Direct Method.
2. Short Cut Method.
3. Step Deviation Method.
1. Direct Method:
In this method, first of all arithmetic mean (x) of the series is calculated. The deviations of individual values from the mean are calculated (d = X -3x) which may be either positive or negative number. The value of d2 is always a positive figure.
Then the standard deviation (S.D. or σ) is calculated as follows:
(i) When the data are unclassified, the following formula is used to calculate the standard deviation:
(ii) When the data are ungrouped and tabulated, the S.D is calculated with the help of the following formula:
(iii) If the data are classified and tabulated then also the same formula is used in the calculation of S.D. as is used for ungrouped data. But, the difference here is that, in case of classified data, the mid-values of different classes are used to calculate the mean (x) and then the deviation (d) of each class is calculated by subtracting the mean from mid-value of each class, i.e., d = (X – x). The deviation squares (d2) are then-multiplied by the frequency (f) of the respective classes to get (fd2). The standard deviation is calculated with the help of the following formula S.D. or ![]()
Short Cut Method for Calculating Standard Deviation:
The method involves the following steps:
ADVERTISEMENTS:
1. Any value of an unclassified series or mid-value of any class in case of classified series is treated as assumed mean (A).
2. The deviation (dx) of individual item or class is calculated by subtracting the assumed mean from the individual data (in case of unclassified series) or mid-value (^Q of each class (in case of classified series) dX = X – A.
3. The deviation values are squared to get dx2 and then for ungrouped data and for classified data separate formulae are used to calculate standard deviation;
Example:
ADVERTISEMENTS:
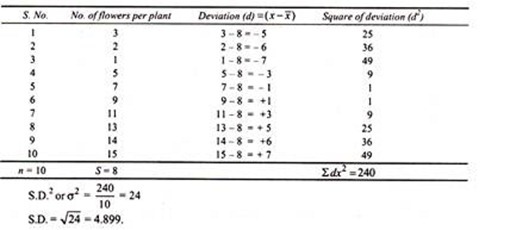
Find out the standard deviation of the following observation regarding the number of flowers per plant.
Example: Calculate the S.D. of the following data on the heights (in cm) of 10 plants. 73,75,80,42,57,65,52,42,47,67.
Example:
Calculate the standard deviation of data presented in the following table:
Merits of Standard Deviation:
1. Standard deviation is mathematically computed and reliable. Therefore it is used in quality research work.
ADVERTISEMENTS:
2. It is based on every individual data of a series.
3. It is least affected by sudden deviations of any type.
4. It is a definite measure of dispersion.
Demerits of Standard Deviation:
1. Method of its calculation is complicated and so inconvenient.
2. In this measure higher values are given more importance than the lower values which affect the S.D. value.


