ADVERTISEMENTS:
Here is a list of top seventeen problems on statistics with their relevant solutions.
Problem 1:
Data from 10 basil (Ocimum basilicum: 2n — 72) plants have been scored and given below:
From the given data can you draw (using suitable statistical test) a relation between cytological attributes and pollen fertility.
ADVERTISEMENTS:
Solution:
The cytological attributes are:
i. Univalent frequency/cell at metaphase I and possible outcome of pairing defects.
ADVERTISEMENTS:
ii. Balanced 36/36 segregation of chromosomes at anaphase I.
To find out whether the cytological attributes are related (significantly) or not—simple correlation analysis is done considering univalent frequency as independent variable (x) and anaphase I separation as dependent (y) variable.
Therefore, the attributes are highly (p > 0.001) and negatively correlated between themselves, i.e., enhanced frequency of univalent per cell has reduced balanced anaphase I segregation of chromosomes.
Now, let us consider the attributes anaphase I segregation of chromosomes (x-variable) and pollen fertility (y-variable) and perform simple correlation between them to ascertain relationship.
Thus, pollen fertility is the outcome of pairing defects (resulting in univalent formation) occurring in earlier stages of meiosis.
Problem 2:
The number of spikelets/branch in rice under 3 different doses of fertilizers (RBD design).
Do you consider that fertilizer doses and sites of irrigation have any effect on mean number of spikelet/branch?
ADVERTISEMENTS:
Solution:
In present case, 9 mean values are there and to find out the effect of fertilizers and site of irrigation on mean number of spikelet/branch one has to perform Analysis of Variance (ANOVA test-F-test). F-test denotes comparison among several mean values.
From Anova Table it can be inferred that—(a) Mean number of spikelet/ branch varied significantly (p > 0.001) among the fertilizer doses, (b) Spikelet number also showed significant variation at 0.01 probability level with sites of irrigation.
CD at 5% is 1.6—Therefore, spikelet number/branch varied- significantly between doses. Medium fertilizer dose is giving the best result.
Similarly, sites of irrigation.
CD = 1.6—From this result it may concluded that there exist no significant variation in mean spikelet number per branch when rice was grown in non- irrigated sites irrespective of upland and lowland.
Final conclusion derived from the data—Irrigated lowland and medium dose of fertilizer have been found to be effective for spikelet number/branch in rice.
Problem 3:
In an experiment the yield of different rice varieties are studied in 3 different seasons.
The results obtained have been given below:
State whether mean yield (kg/acre) of the rice varieties differ among themselves or not and the response of the seasons to varietal performance.
Solution:
Anova (F-test) has to be performed as several means has been considered.
From Anova Table it may be concluded that mean yield of the rice varieties differ significantly among themselves at 1% level; however, yield did not vary with seasons.
Mean yield of IR-8 differs significantly with Jaya and Padma. Jaya differs from Basmati. Padma differs from Basmati.
Problem 4:
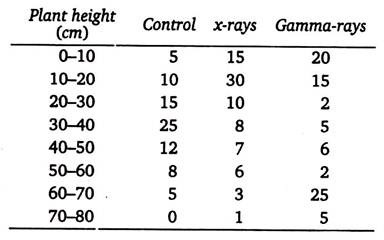
Plant height of 80 individuals have been assessed from normal, X (5kR) and gamma (5kR) irradiated populations and the data obtained have been given below:
Find out mean and draw a frequency polygon with the given data.
ADVERTISEMENTS:
Solution:
1st Set: (Control):
2nd Set: x-Rays:
3rd Set: Gamma-Rays:
Frequency Polygon:
As compared to control mean plant height has been higher in gamma irradiated plants, while it was lower in x-ray treatments. Frequency polygon also reflected mean shift in positive (right) and negative (left) direction than control.
Problem 5:
Five exotic varieties of wheat are to tested against the local in a varietal trial. An experiment was conducted consisting of four fertilizer treatments and a control in a Latin square design. The treatments were numbers as: (1), (2), (3), (4) and (5) out of which (1) was control.
Yields in oz are given below:
Draw your conclusions after analyzing the above data.
Solution:
Conclusion:
Since the calculated values of F for treatment, column and rows are less than the table value of F even at 5% at DF n1 = 4 and n2 = 12, the effects of treatments, column and row are non-significant. Therefore, the differences in yield due to different fertilizer treatments and control are not significant.
Problem 6:
From the following data on yield in gms, quantity of manures (in kg) applied and rainfall in inches calculate the total and partial correlation coefficients and test their significance.
Solution:
Total Correlation Coefficients:
Test of Significance:
In the similar way the significance of correlation coefficients rxz and ryz can be tested.
Conclusion:
Since the calculated value of t for rxy is greater than the table t at DF 6, i.e., 8 —2 or n — 2, the value of rxy is significant which indicates that the yield and quality of manure are highly correlated.
Partial Correlation Coefficients:
Test of Significance:
Conclusion:
The value of the table t at DF 5(8 – 2 – 1) at 5% level is 2.571 which is greater than the calculated value of t. Therefore, rxy.z is not significant which means that the partial correlation between yield and quantity of manure applied eliminating the effect of rainfall is not significant. In the similar way the partial correlation coefficients rxy.z and ryz.x may be tested for significance.
Problem 7:
Two varieties of potato (A and B) yielded tubers as shown in table. Does the mean number of tubers of variety A differ significantly from that of variety B? Mean yield is in kg/plant.
Solution:
Null hypothesis—Mean tuber yield of potato varieties A and B is same.
Comment:
As t-value 2.02 is less than the table value at 5% level (2.10), the mean difference is not significant. Thus, the assumed hypothesis is accepted and it may be concluded that mean yield of tuber in varieties A and B is same.
Problem 8:
Mitotic index (%) in Allium cepa has been evaluated in different samples of variety A and B and the following data has been obtained:
Use a suitable statistical test to show whether mitotic index varied significantly or not between varieties of Allium cepa.
Solution:
Null hypothesis—Mitotic index (mean per 100 cells) in variety A and variety B is same.
Tabulated t-value at 23 DF : 5% level = 2.07 and 1% level = 2.81.
Result indicated that calculated t-value is more than the table value at 0.05 and 0.01 probability levels at 23 DF. Thus, mitotic index of variety A and variety B of Allium cepa differ significantly between themselves.
Problem 9:
Ten black cumin (Nigella sativa L.) plants were assessed after 30 and 45 days for number of flowers produced by each plant and result obtained has been given below:
Test whether mean number of flowers per plant in black cumin was same in two different dates.
Solution:
Null hypothesis—Mean number of flowers are same in two dates of recording.
DF = n – 1 = 10 — 1 =9.
Table value of t at 9DF: 5% = 2.26, 1% = 3.25 and 0.1% = 4.78.
t-test analysis has been done—mean number of flowers were assessed in 2 dates. Further, paired t-test was computed as same plants were scored at 2 different dates.
Conclusion:
The computed i-value is higher than table values at 5%, 1% and 0.1% levels, so the assumed hypothesis is rejected as there exist significant deviation (0.001 probability level) in mean flower number when assessed in two dates.
Problem 10:
Comment on the given data. Segregation data for seed-coat colours in black cumin have been given in tabular form.
Black is wild form; while, the other seed-coat colours are mutant forms. Comment on the data obtained and predict the possible genotypes of the seed-coat colour plants.
Comment:
Reciprocal crosses were made between black seeded normal plants and mutants and subsequently F1 and F2 plants were raised. The F2 plants were used for estimating the segregation ratio for seed-coat colour by using X2-test. The pattern of F2 segregation revealed that dark reddish brown and yellowish brown seed colour were monogenic recessive to black seeds; while, the inheritance of bicolour trait of seeds was under the control of two pairs of recessive genes. Thus, black colouration of seeds in black cumin is dominant over the other seed colours.
Assigning the gene symbols B for black seed colour, bdr for dark reddish brown and bY for yellowish brown colours of seeds and also if we assume that P is responsible for bicolour trait and the dominant form (P) of this gene has no effect on B or on any allelic forms of B (bdr/bY) and that mutation involving both dominant genes (B — P) results to bicolour seeds, then the following genotypes BBPP, bdrbdrPP, bYbYPP and bbpp can be proposed for black, dark-reddish brown, yellowish brown and bicolour seeds, respectively.
Problem 11:
Data representing phenotypic correlation analysis in sesame (Sesamum in- dicum). Comment on the given data:
Comment:
Phenotypic correlation studies have been made between seven yield related traits and their association with yield with the objective to find a model plant type in sesame.
Result indicated that the most important selection criterion for sesame would be plants with enhanced number of capsules and those capsules should be with higher number of seeds. A model sesame plant must also be tall with higher number of capsules on the main axis.
Problem 12:
A plant with red flower (RR) with white stigma (WW) was crossed with a plant having white flower red stigma (rrww) and F2 progenies were developed following selfing of F1 plants:
F2 progenies: Red flower red stigma—25; Red flower white stigma—100; White flower white stigma—25 and White flower and red stigma—100.
Use suitable statistical test to predict the mode of inheritance of the traits.
Solution:
X2-test analysis is performed to predict the inheritance pattern of the concerned qualitative traits.
Null hypothesis (expected): 9:3:3:1 (F2 progenies derived from F1s).
X2 = 488.64 at 3 DF.
The value of X2 is too high (488.64) at 3DF than table value 7.8, thereby indicating significant deviations between observed and expected values. In such case the hypothesis should be rejected but the problem given clearly suggested that it is a classical dihybrid cross and, therefore, the expected ratio should be 9 : 3 : 3 : 1.
Thus, the deviation can be explained on the basis that R and W genes possibly failed to assort independently.
Use of Orthogonal Function (Partitioning the components of Dihybrid cross).
Let flower colour be ‘A’ trait and stigma be ‘B’ trait.
Thus the following result is obtained:
Now it is confirmed that linkage was there between R and W genes—they have failed to assort independently. As x2 has been partitioned into components due to different causes it can be confirmed that discrepancy was also due to failure of segregation of single factor ratios and here lies the significance of the method.
Problem 13:
A Chloroxantha mutant has been spotted at M2 of black cumin. Viable chlorophyll mutant (Chloroxantha—a chlorophyll-deficient mutant) can be used as genetic marker for efficient plant breeding in the species.
Reciprocal crosses were made between normal and Chloroxantha mutant plants and subsequently F1 (all F1 s were of normal colour phenotypes) and F2 plants were raised. The F2 plants were used for estimating the segregation ratio for seedling colours by using the X2-test analysis.
The pattern of F2 segregation (mutant as stigma parent in crossing with normal—25 normal, 15 mutant, X2 = 0.64 for 9 : 7, p-value 0.40 to 0.50; mutant as pollen parent— 48 normal, 28 mutant, X2 = 0.86 for 9 : 7, p-value 0.40 to 0.50) revealed that the inheritance of the Chloroxantha (seedling colour pale greenish yellow) mutant was recessive and was under the control of two gene loci.
Thus;
Reciprocal crossing and use of a statistical test have thrown light on the nature of inheritance of a particular trait and thereby documented the genetics of the trait concerned.
Problem 14:
Secondary groupings in the form of 3 group class (3.13%), 6(28.83%), 9(12.50%), 12(43.75%), 15(8.33%), 18(9.38%) and > 18(2.08%) were observed in metaphase I cells (2n = 72) of Ocimum basilicum (sweet basil). Number of PMCs scored at MI was 304 and 94.74% of the meiocytes were the groupings.
Bivalents and univalents lying in close proximity but always without any distinct material connections has been referred to as Secondary Association of Chromosomes and genetic inter-relationship has been ascribed to be the main causal factor for the phenomenon and has been studied in different plant species in tracing basic chromosome number and polyploid nature of the species.
Solution:
X2-text analysis performed between the group classes (3 to > 18) revealed heterogeneity (X2 = 251.46, DF 6, p-value < 0.001), thereby indicating that chromosomes have assorted themselves more preferentially into certain number of groups (predominantly 12 group class) than they do into others much against random distribution.
In the species, observed cell frequencies for 12 and 6 group classes have only been found to be significantly higher than expected and it was verified by comparing the cell frequency of 12 (observed 12 group class 126, rest 162, expected 12 group class 41.14, rest 246.86, total 288, X2 = 204.21 at 1 DF, p > 0.001) and 6 (observed 6 group class 60, rest 228, expected 6 group class 41.14, rest 246.86, total 288, X2 = 10.09 at 1 DF, p < 0.001) group classes against the pooled frequency of rest of the classes.
Comments:
Secondary association of chromosomes in O. basilicum (sweet basil, Tulsi) has suggested secondary polyploid nature of the species and statistical analysis of cytological data has indicated that the basic chromosome number of the species is 12 which probably evolved from ancestral basic number x = 6 through polyploidy.
Inference:
O. basilicum is not a true diploid rather a derived polyploid (secondary polyploid) whose n = 36 but x = 12.
Problem 15:
Twenty-two genotypes of sesame (Til plant) were grown in RBD with 3 replications and data have been estimated for 8 yield related traits and yield from 5 randomly selected plants from each plot in each generation over 2 years (data pooled over generations) for studying genetic variability, character association and path analysis.
Objective:
To understand the contribution of each yield related trait to yield and to select component maximizing yield.
Solution:
Results obtained from Statistical Analysis:
Table:
Estimates of parameters of variability, heritability and genetic advance from different characters in sesame genotypes.
The estimates of genetic parameters indicated that the magnitude of GCV (genotypic coefficient of variation) and PCV (phenotypic coefficient of variation) was of high order for all the traits and PCV was higher than the corresponding GCV values.
The heritability estimated ranged from 19.32% to 91.0% among the traits. High degree of heritability was obtained for plant height, seeds/capsule, number of capsules/plant and distance from base to first branching; while, it was moderate to low for other traits.
High heritability coupled with high genetic advance is being considered as effective criteria for selection for improvement in yield and has been noted for number of capsules/plant and distance from base to first branching.
Table:
The genotypic and phenotypic correlation coefficients of different characters in sesame:
Correlation studies showed that for all characters, genotypic and phenotypic associations were in the same direction and genotypic estimates were higher than the phenotypic ones indicating an inherited association between the traits. The yield showed a strong positive association (0.001 probability level) with all yield related traits excepting distance from base to first branching.
Similarly, correlation among the yield components was mostly positive and significant (excepting distance from base to first branching with capsule or main axis, capsule/plant, and capsule length and between total branches/plant and capsule on the main axis).
Table:
Direct and indirect effects of contributing characters on seed yield of sesame:
Residual effect = 0.0802; Figures in bold are the direct effects; *** Significant at 0.1% level.
In addition to the degree of associations path coefficient analysis takes into account the cause and effect relationship and has been performed to partition the genotypic correlation into direct and indirect effects for understanding the relative importance of the component characters on yield.
The perusal of path analysis revealed that capsules per plant (1.243) had maximum positive direct effect followed by capsule (1.243) had maximum positive direct effect followed by capsule length (1.054), seeds/capsule (0.454) and total branches/plant (0.691). Further, indirect contribution via these traits on yield was also very high and positively significant.
Thus, path analysis led to the inference that number of total branches and capsules per plant, capsule length and seeds per capsule are the important selection criteria for yield improvement.
Stepwise regression analysis performed with yield components as independent variables (X1) and seed yield as dependent variable (Y) revealed that Y = 4.67 + 0.03X1 + 0.07X2 + 1.71X3 as the best fitted equation (where X1 = seeds per capsule, X2 = capsule length and X3 = seeds per capsule; R2 0.62, standard error of estimate 1.06) and these three traits (X1, X2 and X3) are explaining more than 62.0 per cent variables of the total variations. This statistical analysis laid emphasis on simultaneous selection of capsules per plant, capsule length and seeds per capsule.
Inference:
Different statistical analysis have been performed to select traits for improvement in sesame genotypes.
(a) Extension of statistical analysis gave precise account of the traits to be selected—those are maximizing yield.
(b) These traits will be helpful for efficient breeding in sesame through the development of recombinant genotypes.
Problem 16:
Table: Mean values for different quantitative characters in normal and in three seed-coat mutants of black cumin.
Experiment:
Selfed progenies of seed-coat colour mutant plants and black seeded normal plants were grown in randomized block design with 3 replications. Observation in 5 randomly selected plants from each row and a total of 60 plants from 3 replications were recorded for different quantitative traits in control and in the mutant plant types and pooled mean with standard error have been presented in table.
F-analysis among the plant types have been made for different traits and has been documented in the form of CD at 5% level.
Comment:
Phenotypic data indicated that dark reddish brown seed-coat mutant was as productive as normal; while the bicolour and the yellowish brown seed- coat mutants were short sized and small seeded plants.
Problem 17:
Table: Meiotic analysis in tetraploid black cumin (Nigella sativa L.)
Comment:
Chi-square test of heterogeneity revealed that the frequency of bi- valents and quadrivalents per cell among the tetraploids was random (that is there exist no significant variations) but the number of univalents per cell was non-random.
The univalent frequency per cell among tetraploids demonstrated significant positive correlation with abnormal anaphase I cells (r = 0.81), the abnormal anaphase I cells showed significant negative correlation with pollen fertility (r = —0.99): Thus, cytological examination of chromosomes in the induced autotetraploids of black cumin leads to the conclusion that reduction in pollen fertility was the result of chromosomal disturbances arising from pairing irregularities.
(a) X2-test of heterogeneity.
(b) Simple correlation analysis.
Provided sufficient cytagenetical information from the given data.


