ADVERTISEMENTS:
Read this article to learn about the principles of flowcytometry.
Introduction:
The fluorescent antibody techniques described are extremely valuable qualitative tools, but they do not give quantitative data.
This shortcoming was remedied by development of the flow cytometer, which was designed to automate the analysis and separation of cells stained with fluorescent antibody.
ADVERTISEMENTS:
The flow cytometer uses a laser beam and light detector to count single intact cells in suspension. Every time a cell passes the laser beam, light is deflected from the detector, and this interruption of the laser signal is recorded. Those cells having a fluorescently tagged antibody bound to their cell surface antigens are excited by the laser and emit light that is recorded by a second detector system located at a right angle to the laser beam.
The simplest form of the instrument counts each cell as it passes the laser beam and records the level of fluorescence the cell emits; an attached computer generates plots of the number of cells as the ordinate and their fluorescence intensity as the abscissa. More sophisticated versions of the instrument are capable of sorting populations of cells into different containers according to their fluorescence profile.
Use of the instrument to determine which and how many members of a cell population bind fluorescently labelled antibodies is called analysis; use of the instrument to place cells having different patterns of reactivity into different containers is called cell sorting. The flow cytometer has multiple applications to clinical and research problems. A common clinical use is to determine the kind and number of white blood cells in blood samples.
By treating appropriately processed blood samples with a fluorescently labelled antibody and performing flow cytometric analysis, one can obtain the following information:
ADVERTISEMENTS:
i. How many cells express the target antigen as an absolute number and also as a percentage of cells passing the beam. For example, if one uses a fluorescent antibody specific for an antigen present on all T cells, it would be possible to determine the percentage of T cells in the total white blood cell population. Then, using the cell-sorting capabilities of the flow cytometer, it would be possible to isolate the T-cell fraction of the leukocyte.
ii. The distribution of cells in a sample population according to antigen densities as determined by fluorescence intensity. It is thus possible to obtain a measure of the distribution of antigen density within the population of cells that possess the antigen. This is a powerful feature of the instrument, since the same type of cell may express different levels of antigen depending upon its developmental or physiological state.
iii. The size of cells. This information is derived from analysis of the light-scattering properties of members of the cell population under examination. Flow cytometry also makes it possible to analyze cell populations that have been labelled with two or even three different fluorescent antibodies. For example, if a blood sample is reacted with a fluorescein-tagged antibody specific for T cells, and also with a phycoerythrin-tagged antibody specific for B cells, the percentages of B and T cells may be determined simultaneously with a single analysis.
Numerous variations of such “two-colour” analyses are routinely carried out, and “three-colour” experiments are common. Aided by appropriate software, highly sophisticated versions of the flow cytometer can even perform “five-colour” analyses.
Principles of Flowcytometry:
Fluidics System:
One of the fundamentals of flow cytometry is the ability to measure the properties of individual particles. When a sample in solution is injected into a flow cytometer, the particles are randomly distributed in three-dimensional space. The sample must, therefore, be ordered into a stream of single particles that can be interrogated by the machine’s detection system.
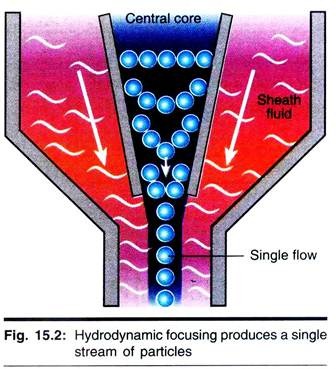
This process is managed by the fluidics system. Essentially, the fluidics system consists of a central channel/core through which the sample is injected, enclosed by an outer sheath that contains faster flowing fluid. As the sheath fluid moves, it creates a massive drag effect on the narrowing central chamber.
This alters the velocity of the central fluid whose flow front becomes parabolic with greatest velocity at its centre and zero velocity at the wall. The effect creates a single file of particles and is called hydrodynamic focusing. Under optimal conditions (laminar flow) the fluid in the central chamber will not mix with the sheath fluid.
The flow characteristics of the central fluid can be estimated using Reynolds Number (Re):
ADVERTISEMENTS:
Re = pVD/µ
where D – tube diameter; V — mean velocity of fluid; p density of fluid; and µ = viscosity of fluid
When Re < 2300, flow is always laminar. When Re > 2300, flow can be turbulent, which accelerates diffusion. Without hydrodynamic focusing the nozzle of the instrument (typically 70 µM) would become blocked, and it would not be possible to analyze one cell at a time.
Optics and Detection:
After hydrodynamic focusing, each particle passes through one or more beams of light. Light scattering or fluorescence emission (if the particle is labelled with a fluorochrome) provides information about the particle’s properties. The laser and the arc lamp are the most commonly used light sources in modern flow cytometry.
ADVERTISEMENTS:
Lasers produce a single wavelength of light (a laser line) at one or more discrete frequencies (coherent light). Arc lamps tend to be less expensive than lasers and exploit the colour emissions of an ignited gas within a sealed tube. However, this produces unstable incoherent light of a mixture of wavelengths, which needs subsequent optical filtering.
Light that is scattered in the forward direction, typically up to 20″ offset from the laser beam’s axis, is collected by a lens known as the forward scatter channel (FSC). The FSC intensity roughly equates to the particle’s size and can also be used to distinguish between cellular debris and living cells.
Light measured approximately at a 90° angle to the excitation line is called side scatter. The side scatter channel (SSC) provides information about the granular content within a particle. Both FSC and SSC are unique for every particle, and a combination of the two may be used to differentiate different cell types in a heterogeneous sample.
ADVERTISEMENTS:
Fluorescence measurements taken at different wavelengths can provide quantitative and qualitative data about fluorochrome-labelled cell surface receptors or intracellular molecules such as DNA and cytokines. Flow cytometers use separate fluorescence (FL) channels to detect light emitted.
The number of detectors will vary according to the machine and its manufacturer. Detectors are either silicon photodiodes or photomultiplier tubes (PMTs). Silicon photodiodes are usually used to measure forward scatter when the signal is strong. PMTs are more sensitive instruments and are ideal for scatter and fluorescence readings.
The specificity of detection is controlled by optical filters, which block certain wavelengths while transmitting (passing) others. There are three major filter types. ‘Long pass’ filters allow through light above a cut-off wavelength, ‘short pass’ permit light below a cut-off wavelength and ‘band pass’ transmit light within a specified narrow range of wavelengths (termed a bandwidth).
All these filters block light by absorption. When a filter is placed at a 45° angle to the oncoming light it becomes a dichroic filter/mirror. As the name suggests, this type of filter performs two functions; first, to pass specified wavelengths in the forward direction and, second, to deflect blocked light at a 90° angle. To detect multiple signals simultaneously, the precise choice and order of optical filters will be an important consideration.
Signal Processing:
ADVERTISEMENTS:
When light hits a photo detector a small current (a few microamperes) is generated. Its associated voltage has an amplitude proportional to the total number of light photons received by the detector. This voltage is then amplified by a series of linear or logarithmic amplifiers, and by analog to digital convertors (ADCs), into electrical signals large enough (5-10 volts) to be plotted graphically.
Log amplification is normally used for fluorescence studies because it expands weak signals and compresses strong signals, resulting in a distribution that is easy to display on a histogram Linear scaling is preferable where there is not such a broad range of signals, e.g., in DNA analysis.
The measurement from each detector is referred to as a ‘parameter’, e.g., forward scatter, side scatter or fluorescence. The data acquired in each parameter are known as the ‘events’ and refer to the number of cells displaying the physical feature or marker of interest.
Electrostatic Cell Sorting:
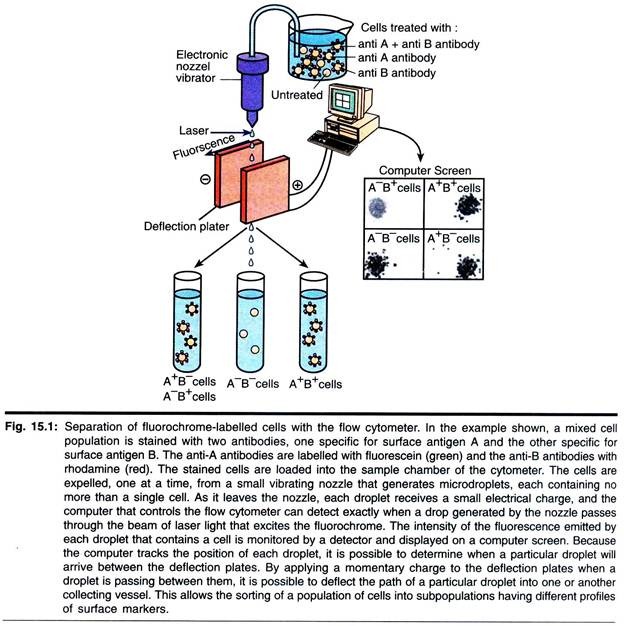
A major application of flow cytometry is to separate cells according to subtype or epitope expression for further biological studies. This process is called cell sorting or FACSTM analysis. After the sample is hydro-dynamically focused, each particle is probed with a beam of light. The scatter and fluorescence signal is compared to the sort criteria set on the instrument.
ADVERTISEMENTS:
If the particle matches the selection criteria, the fluid stream is charged as it exits the nozzle of the fluidics system. Electrostatic charging actually occurs at a precise moment called the ‘break-off point’, which describes the instant droplet containing the particle of interest separated from the stream.
To prevent the break-off point happening at random distances from the nozzle and to maintain consistent droplet sizes, the nozzle- is vibrated at high frequency. The droplets eventually pass through a strong electrostatic field, and are deflected left or right based on their charge (Fig. 15.4). The speed of flow sorting depends on several factors including particle size and the rate of droplet formation.
A typical nozzle is between 50-70 µm in diameter and, depending on the jet velocity from it, can produce 30,000-100,000 droplets per second, which is ideal for accurate sorting. Higher jet velocities risk the nozzle becoming blocked and will also decrease the purity of the preparation.
Immunophenotyping:
All normal cells express a variety of cell surface markers, dependent on the specific cell type and degree of maturation. However, abnormal growth may interfere with the natural expression of markers resulting in overexpression of some and under-representation of others.
ADVERTISEMENTS:
Flow cytometry can be used to immunophenotype cells and thereby distinguish between healthy and diseased cells. It is unsurprising that today immunophenotyping is one of the major clinical applications of flow cytometry, and is used to aid the diagnosis of myelomas, lymphomas and leukemia’s. It can also be used to monitor the effectiveness of clinical treatments.
The differences between the blood profiles of a healthy individual and one suffering from leukemia, for instance, are very dramatic. This can be seen from the FSC vs. SSC plots in Fig. 15.17. In the healthy person the cell types are clearly defined, whereas blood from a leukemia patient is abnormal and does not follow the classic profile.
Testing the patient’s lymphocytes for specific cell surface markers also reveals more about the condition.
CD3:
A normal person has a significant proportion of CD3-positive lymphocytes. In the patient with leukemia, staining for CDS is absent.
CD20:
In the leukemia patient there are a large number of cells staining positive for CD20. In the healthy person only a few stain positive.
HLA-DR:
The leukemia patient is HLA-DR-positive. In the normal person only a small number of cells stain positive. Being CD3-negative, CD20-positive and HLA-DR-positive, a clinician could diagnose with certainty that this patient is suffering from a B cell lineage leukemia or lymphoma. The precise classification of disease may be determined using further antibodies.
Sample Preparation:
Single cells must be suspended at a density of 105-107 cells/ml to prevent the narrow bores of the flow cytometer and its tubing from clogging up. The concentration also influences the rate of flow sorting, which typically progresses at 2000-20,000 cells/second. However, higher sort speeds ma; decrease the purity of the preparation.
Phosphate buffered saline (PBS) is a common suspension buffer and the most straightforward samples for flow cytometry include non-adherent cells from culture, water-borne micro-organisms, bacteria and yeast. Even whole blood is easy to use – red cells are usually removed by a simple lysis step; it is then possible to quickly identify lymphocytes, granulocytes and monocytes by their FSC/SSC characteristics.
However, researchers may also wish to analyze cells from solid tissues, e.g., liver or tumours. In order to produce single cells, the solid material must be disaggregated. This can be done either mechanically or enzymatically. Mechanical disaggregation is suitable for loosely bound structures, e.g., adherent cells from culture, bone marrow and lymphoid tissue. It involves passing a suspension of chopped tissue through a fine-gauge needle several times, followed by grinding and sonication as necessary.
Enzymes are used to disrupt protein-protein interactions and the extracellular matrix that hold cells together. Their action is dependent on factors including pH, temperature and co-factors, so care must be taken when choosing an enzyme. For example, pepsin works optimally between pH 1.5-2.5 but the acidic conditions would damage cells if left un-neutralized for too long, and cell surface antigens of interest may be lost.
Chelators like EDTA and EGTA can remove divalent cations responsible for maintaining cell function and integrity but their presence may inhibit certain enzymes, for instance, collagenase re quires Ca2+ for activity. Enzymatic and mechanical disaggregation is often a trial and error process to optimize the isolation of the epitope under investigation.
To study intracellular components, e.g. cytokines by flow cytometry, the plasma membrane of the cell must be permeabilized to allow dyes or antibody molecules through while retaining the cell’s overall integrity. Low concentrations (up to 0.1%) of non-ionic detergents like saponin are suitable. In summary, the method for sample preparation will depend on the starting material and the nature of the epitope.


