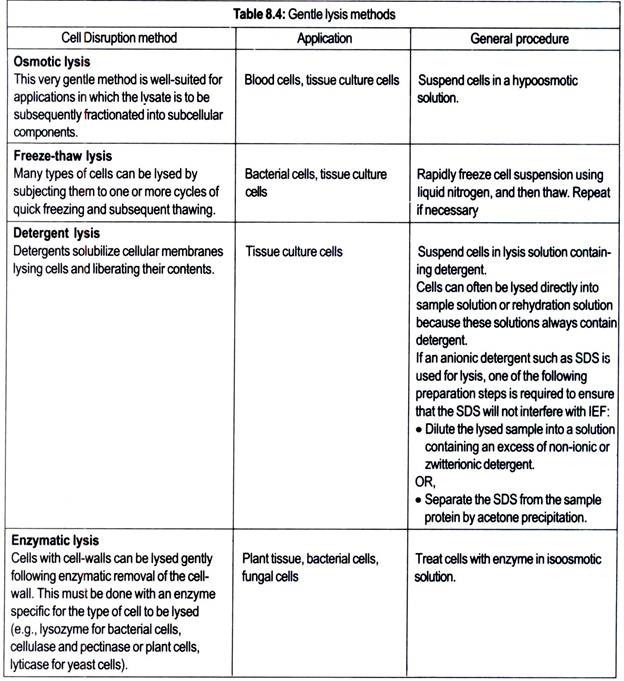
ADVERTISEMENTS:
This article throws light upon the top ten types of electrophoretic techniques used in biochemistry.
The ten types of electrophoretic techniques used in biochemistry are: (1) Horizontal and Vertical Gel Electrophoresis Systems (2) Agarose Gel Electrophoresis (3) Polyacrylamide Gels (4) Sodium Dodecyl Sulphate-Polyacrylamide Gel Electrophoresis (5) Native (Buffer) Gels (6) Gradient Gels (7) Capillary Electrophoresis (8) Cellulose Acetate Electrophoresis (9) Isoelectric Focusing and Two-Dimensional Gel Electrophoresis and (10) Microchip Electrophoresis.
Technique # 1. Horizontal and Vertical Gel Electrophoresis Systems:
The equipment required for electrophoresis consists basically of two items, a power pack and an electrophoresis unit. Electrophoresis units are available for running either vertical or horizontal gel systems. Vertical slab gel units are commercially available and routinely used to separate proteins in acrylamide gel.
ADVERTISEMENTS:
The gel is formed between two glass plates that are clamped together but held apart by electrical spacers.
The most commonly used units are the so called mini gel apparatus. Gel dimensions are typically 8.5 cm wide x 5 cm high, with a thickness of 0.5-1 mm. A plastic comb is placed in the gel solution and is removed after polymerization to provide loading wells up to 10 samples. When the apparatus is assembled, the lower electrophoresis tank buffer surrounds the gel plates and affords some cooling of the gel plates. A typical horizontal gel system is shown in Fig. 8.1.
The gel is cast on a glass or plastic sheet and placed on a cooling plate (an insulated surface through which cooling water is passed to conduct away generated heat). Connection between the gel and electrode buffer is made using a thick wad of wetted filter paper. Note, however, that agarose gel for DNA electrophoresis are run submerged in the buffer.
ADVERTISEMENTS:
The power pack supplies a direct current between the electrodes in the electrophoresis unit. All electrophoresis are carried out in an appropriate buffer, which is essential to maintain a constant state of ionization of the molecules being separated. Any variation in pH will alter the overall charge and hence the mobilities (rate of migration in the applied field) of the molecules are separated.
Technique # 2. Agarose Gel Electrophoresis:
Agarose is a linear polysaccharide (average relative molecular mass about 12000) made up of the basic repeat unit agarobiose, which comprises alternating units of the galactose and 3, 6- anhydrogalactose (Fig. 8.4).
Agarose is one of the components of agar that is mixture of polysaccharides isolated from certain seaweeds. Agarose is usually used at a concentration between 1% and 3%. Agarose gels are formed by suspending dry agarose in aqueous buffer, then boiling the mixture until a clear solution is formed. This is poured and allowed to cool to room temperature to form a rigid gel.
The gelling properties are attributed to both inter- and intermolecular hydrogen bonding within and between the long agarose chains. This cross-linked structure gives the gel good anti-conventional properties. The pore size in the gel is controlled by the initial concentration of agarose; large pore sizes are formed from low concentration and smaller pore sizes are formed from higher concentrations.
Although essentially free from charge, substitution of the alternating sugar residues with carboxyl, methoxyl, pyruvate and specially sulphate group occur to varying degrees. This substitution can result in electroendoosmosis during electrophoresis and ionic interactions between the gel and sample in all uses, both unwanted effects. Agarose is, therefore, sold in very different purity grades, based on sulphate concentration — the lower the sulphate content the higher the purity.
Agarose gels are used for the electrophoresis of both proteins and nucleic acids. For proteins, the pore sizes of a 1% agarose gel are large relative to the sizes of proteins. Agarose gels are therefore used in techniques such as Immunoelectrophoresis or flat bed isoelectric focusing, where the proteins are required to move unhindered in the gel matrix according to their native charge.
ADVERTISEMENTS:
Such large pore gels are also used to separate much larger molecules such as DNA or RNA, because the pore sizes in the gel are still large enough for DNA or RNA molecule to pass through the gel. Now, however, the pore size and molecule size are more comparable and frictional effects begin to play a role in the separation of these molecules.
A further advantage of using agarose is the availability of low melting temperature agarose (62-65°C). As the name suggests, these gels can be re-liquefied by heating to 65°C and thus, for example, DNA samples separated in a gel can be cut out of the gel, returned to solution and recovered.
Owing to the poor elasticity of agarose gels and the consequent problems of removing them from small tubes, the gel rod system is sometimes used, since acrylamide gel is not used. Horizontal slab gels are invariably used for isoelectric focusing or immunoelectrphoresis in agarose. Horizontal gels are also used routinely for DNA and RNA gels, although vertical systems have been used by some workers.
Agarose Gel Electrophoresis of Nucleic Acids:
Nucleic acids are polymers composed of individual nucleotide units. The units are connected via phosphate diester linkages of the backbone sugars. The net effect of these linkages is to give the polymers a net negative charge. From the earliest days of electrophoresis it has been axiomatic that molecules carrying an electrical charge will migrate in an electrical field in a predictable manner.
When subjected to an electrical field, a molecule carrying a net negative charge will migrate toward the positive pole and a molecule with a net positive charge will migrate toward the negative pole. In a semi-solid matrix like agarose, the equation describing mobility can be re-interpreted, at least heuristically, by defining gas gel density or concentration and r as the length of the molecule.
Thus, when they are placed in the semi-solid matrix of a gel, nucleic acids will migrate toward the positive pole in a predictable and reproducible manner that can be described as a negative exponential function of length. That is to say, shorter molecules will migrate faster and longer molecules will migrate slower. Indeed, in the case of a nucleic acid in a gel in an electrical field, every other element of the migration expression is a constant and mobility is completely determined by molecular length.
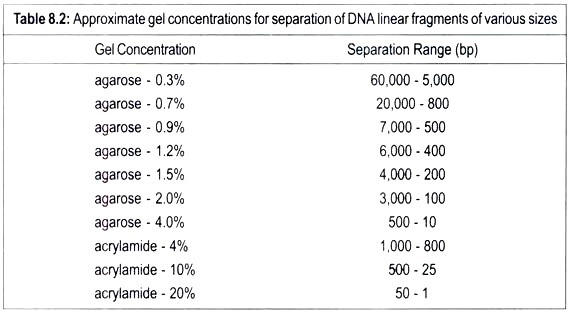
As a matter of practice, it is difficult to accurately resolve double-stranded nucleic acids smaller than about 100 bases in an agarose gel because the sieving properties of agarose are not fine enough. On the other end of the scale, molecules longer than about 25,000 bp but shorter than around 2,000,000 bp will all run at the same rate. This is called limiting mobility.
Nucleic acid molecules longer than 2,000,000 bp will not even enter an agarose gel. Thus, the effective size range for agarose gel electrophoresis of double stranded nucleic acids is between 100 bp and 25,000 bp. In this range the behaviour of the molecule is precise and predictable. This behaviour is shown in Fig. 8.8. As can be seen there is minimal separation of the larger fragments but resolution improves as the fragments get smaller.
While this phenomenon has been known for many years, what was not known was how the nucleic acid molecules actually moved in the gel matrix. In the 1980s a theory was put forward that nucleic acids migrated through the gel much the same way that a snake moves. That is, the leading edge moves forward and pulls the rest of the molecule with it.
ADVERTISEMENTS:
In this model, as the molecule gets longer resistance being pulled along increases. This resistance is further increased by the interaction of the molecule with the gel matrix. The increase in resistance is non-linear. This model, called “biased reptation”, is sufficient to explain all of the behaviour of a nucleic acid in a semi-solid matrix (Lerman et al, 1982; Lumpkin et al., 1985).
In 1989 a group at the University of Washington put this theory to the test. They filmed DNA molecules moving through an agarose gel. Their films showed both reptation and the nucleic acid/ gel matrix interactions (Smith et al., 1989).
In the mid-1980s a number of methods were developed to electrophoretically analyze nucleic acid molecules in the limiting mobility size range. The solution involved artificially introducing a size dependent mobility on nucleic acid molecules by altering the electrophoretic field. The first such alteration involved simply switching the polarity of the field in a regular pattern. Carle et al. (1986) showed that periodic reversals of polarity would induce the molecules to make U-turns in the gel.
Even at very large sizes, this turning would permit separation of molecules. In the length of time the molecules were reversed was about one-third the time they were oriented forward, for example, three seconds forward and one second back, molecules as large as 2,000,000 bp could be resolved in a standard agarose gel in a few hours. The first practical demonstration of this method, called Field Inversion Gel Electrophoresis (FIGE), was to completely resolve intact yeast chromosomes. Since then, a variety of methods, collectively termed pulsed-field gel electrophoresis, have been developed.
Many laboratories routinely use 0.8% gels, which are suitable for separating DNA molecules in the range 0.5- 10 kb. Since agarose gels separate DNA according to size, the Mr of a DNA fragment may be determined from its electrophoretic mobility by running a number of standard DNA markers of known Mr on the same gel. This is most conveniently achieved by running a sample of bacteriophage λ DNA (49 kb) that has been cleaved with a restriction enzyme such as EcoRI. Since the base sequence of λ DNA is known, and the cleavage sites for EcoRl are known, this generates fragments of accurately known size.
ADVERTISEMENTS:
DNA gels are invariably run as horizontal, submarine or submerged gels; so named because such a gel is totally immersed in buffer. Agarose, dissolved in gel buffer by boiling, is poured onto a glass or plastic plate, surrounded by a wall of adhesive tape or a plastic frame to provide a gel about 3 mm in depth. Loading wells are formed by placing a plastic well-forming template or comb in the poured gel solution, and removing this comb once the gel is set.
The gel is placed in electrophoresis tank, covered with buffer, and samples loaded by directly injecting the sample into the wells. Samples are prepared by dissolving them in a buffer solution that contains sucrose, glycerol or Ficoll, which makes the solution dense and allows it to sink to the bottom of the well. A dye such as bromophenol blue is also included in the sample solvent; it makes it easier to see the sample that is being loaded and also acts as a marker of the electrophoresis front.
No stacking gel is needed for the electrophoresis of DNA because the mobilities of DNA molecules are much greater in the well than in the gel, and therefore, all the molecules in the well pile up against the gel within a few minutes of the current being turned on, forming a tight band at the start of the run.
General purpose gels are approximately 25 cm long and 12 cm wide, and are run at a voltage gradient of about 1.5 V cm-1 overnight. A higher voltage would cause excessive heating. For rapid analyses that do not need extensive separation of DNA molecules, it is common to use mini-gels that are less than 10 cm long. In this way information can be obtained in 2-3 h.
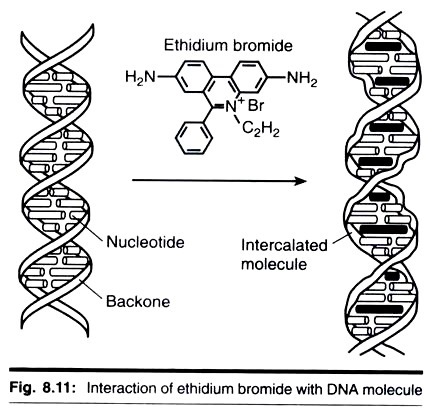
Once the system has been run, the DNA in the gel needs to be stained and visualized. The reagent most widely used is the fluorescent dye ethidium bromide. The gel is rinsed gently in a solution of ethidium bromide (0.5 µg cm-1) and then viewed under ultraviolet light (300 nm wavelength). Ethidium bromide is a cyclic planar molecule that binds between the stacked base-pairs of DNA (i.e., it intercalates).
ADVERTISEMENTS:
The ethidium bromide concentration, therefore, builds up at the site of DNA bands and under ultraviolet light the DNA bands fluoresce orange-red. As little as 10 ng of DNA can be visualized as a 1 cm wide band. It should be noted that extensive viewing of DNA with ultraviolet light can result in damage of the DNA by nicking and base-pair dimerization.
This is of no consequence if the gel is only to be viewed, but obviously viewing of the gel should be kept to a minimum if the DNA is to be recovered. It is essential to protect one’s eye by wearing goggles when ultraviolet light is used. If viewing of gel under ultraviolet is carried out for long periods, a plastic mask that covers the whole face should be used to avoid ‘sunburn’.
DNA Sequencing Gels:
Although agarose gel electrophoresis of DNA is a ‘workhorse’ technique for the molecular biologists, a different form of electrophoresis has to be used when DNA sequences are to be determined. Whichever DNA sequencing method is used, the final analysis usually involves separating single-stranded DNA molecules shorter than about 1000 nt and differing in size by only 1 nt.
To achieve this it is necessary to have a small-pored gel and so acrylamide gels are used instead of agarose. For example, 3.5% polyacrylamide gels are used to separate DNA in the range 80-1000 nt and 12% gels to resolve fragments of between 20-100 nt. If a wide range of sizes is being analysed it is often convenient to run a gradient gel, for example, from 3.5% to 7.5%.
Sequencing gels are run the presence of denaturing agents, urea and form amide. Since it is necessary to separate DNA molecules that are very similar in size, DNA sequencing gels tend to be very long (100 cm) to maximize the separation achieved. A typical DNA sequencing gel is shown in Fig. 8.12.
As mentioned above, electrophoresis in agarose can be used as a preparative method for DNA.
The DNA bands of interest can be cut out of the gel and the DNA recovered by:
(a) Electro elution,
(b) Macerating the gel piece in buffer, centrifuging and collecting the supernatant; or
(c) If low melting point agarose is used, melting the gel piece and diluting with buffer.
In each case, the DNA is finally recovered by precipitation of the supernatant with ethanol.
Pulsed-field Gel Electrophoresis:
Manipulating and analyzing DNA are fundamental in the field of molecular biology. Indeed, separating complex mixtures of DNA into different sized fragments by electrophoresis was a well-established technique by the early 1970s. Typically, DNA was isolated intact and then treated with restriction enzymes to generate pieces small enough to be resolved by electrophoresis in agarose or acrylamide. Although this procedure still forms the core of DNA separation and analysis in today’s laboratories, the rules of the separation have changed.
In 1984, Schwartz and Cantor described pulsed field gel electrophoresis (PFGE), introducing a new way to separate DNA. In particular, PFGE resolved extremely large DNA for the first time, raising the upper size limit of DNA separation in agarose from 30-50 kb to well over 10 Mb (10,000 kb). Now, instead of cloning a large number of small fragments of DNA, PFGE permits cloning and analysis of a smaller number of very large pieces of a genome.
Although the theory of pulsed field electrophoresis is a matter of debate, qualitative statements can be made about the movement of DNA in agarose gels during PFGE. During continuous field electrophoresis, DNA above 30-50 kb migrates with the same mobility regardless of size. This is seen in a gel as a single large diffuse band. If, however, the DNA is forced to change direction during electrophoresis, different sized fragments within this diffuse band begin to separate from each other.
With each reorientation of the electric field relative to the gel, smaller sized DNA will begin moving in the new direction more quickly than the larger DNA. Thus, the larger DNA lags behind, providing a separation from the smaller DNA. Currently, there are three models that attempt to describe the behaviour of DNA during PFGE, the biased reptation model (BRM), the chain model, and, most recently, the bag model.
Instrumentation:
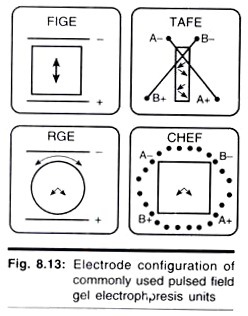
Although many types of PFGE instrumentation are available (Fig. 8.13), they generally fall into two categories. The simplest equipment is designed for field inversion gel electrophoresis (FIGE). FIGE works by periodically inverting the polarity of the electrodes during electrophoresis. Because FIGE subjects DNA to a 180° reorientation, the DNA spends a certain amount of time moving backwards.
Only an electrical field switching module is needed; any standard vertical or horizontal gel box that has temperature control can be used to run the gel. Although more complex in its approach, zero integrated field electrophoresis (ZIFE) also falls into this first category. Compared with simple FIGE, ZIFE is very slow. However, ZIFE is capable of resolving larger DNA and giving a larger useful portion of the gel.
The other category contains instruments that reorient the DNA at smaller oblique angle, generally between 96° and 120°. This causes DNA to always move forward in a zigzag pattern down the gel. For a similar size range under optimal conditions, these separations are faster, resolve a wider size range, and give a larger useful portion of the gel compared to their other counter parts.
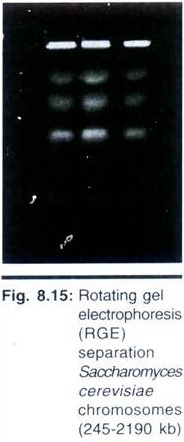
Contour-clamped homogeneous electric field (CHEF); transverse alternating field electrophoresis (TAFE) and its relative ST/RIDEtm; and rotating gel electrophoresis (RGE) are all examples of commonly used transverse angle reorientation techniques for which instrumentation is available.
In a further elaboration of the above procedures, Lai and Coworkers developed the programmable autonomously controlled electrophoresis (PACE) unit which allows complete control over reorientation angle, voltage, and switch time. In contrast with FIGE, these systems require both a special gel box with a specific electrode and gel geometry, and the associated electronic control for switching and programming the electrophoresis run.
Ideally, the DNA should separate in straight lanes to simplify lane-to-lane comparisons. The original pulsed-field systems used inhomogeneous electric fields that did not produce straight lanes, making interpretation of gels difficult. Again, the simplest approach to straight lanes is FIGE, which uses parallel electrodes to assure a homogeneous electric field.
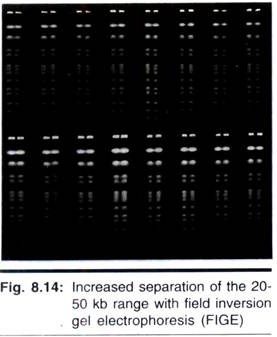
Although extremely useful for separating relatively small DNA, 4- 1,000 kb (Fig. 8.14), FIGE’s reorientation angle of 180° results in a separation range most useful under 2,000 kb. Furthermore, like other PFGE techniques, FIGE has mobility inversions in which larger DNA can move ahead of smaller DNA during electrophoresis.
Ramping, where the reorientation pulse length is constantly increased during separation, will minimize inversions. This capability is included in most commercial instrumentation. Increasing both the separation range and the resolution of large DNA requires smaller reorientation angles, generally 96-140° with 120° most common. Smaller angles (e.g., 100°) increase the mobility of the DNA generally without seriously affecting resolution. The lower limit is approximately 96°. Below this, separation is seriously compromised.
TAFE and ST/RIDEtm use a complicated geometry between the electrodes and a vertically placed gel to get straight lanes. CHEF and RGE maintain a homogeneous electric field in combination with a horizontal gel. CHEF changes the direction of the electric field electronically to reorient the DNA by changing the polarity of an electrode array. With RGE the electric field is fixed; to move the DNA in a new direction, the gel simply rotates.
Rotating Gel Electrophoresis:
RGE is one of the most recent commercial introductions of pulsed field equipment and combines variable angles with a homogeneous electric field. The electrodes are positioned along opposite sides of the buffer chamber with their polarity fixed. Briefly, the gel is cast on a circular running plate and then placed in the buffer chamber. The gel is coupled to a magnetic drive beneath the buffer chamber to eliminate the possibility of leakage that a direct connection might cause.
To force the migrating DNA to a new direction, the magnetic drive simply rotates the gel to the new angle. Because the reorientation angle of the DNA is determined by a straightforward mechanical coupling, RGE offers a lot of flexibility at a reduced cost. Voltage, angle, and pulse times are varied with the program stored into memory of the unit.
Along with the ability to separate large DNA came the need for new sample preparation and handling procedures. Large DNA (e.g., yeast chromosomes) is easily sheared and also difficult to pipette due to its high viscosity. The solution to this problem is to first embed the bacteria or yeast in agarose plugs and then treat the plugs with enzymes to digest away the cell wall and proteins, thus leaving the naked DNA undamaged in the agarose. The plugs then are cut to size, treated with restriction enzymes, if necessary, loaded in the sample well, and sealed into place with agarose.
Several parameters act in concert during PFGE. These will be discussed briefly below as they relate to transverse field instruments such as RGE. The minimum amount of information needed to repeat a separation should include a short description of the pulsed field instrumentation used; applied voltage and field strength (e.g., 180 V at 5.3 V/cm); pulse length (e.g., 87 seconds); reorientation angle (e.g., 120°); the buffer (0.5X TBE); the agarose type and concentration; the buffer chamber temperature (e.g., 10°C); the type of standards; and, if possible, the amount of DNA loaded.
Although the data listed above is necessary to faithfully reproduce a separation, the information supplied in publications is rarely this complete. Most PFGE systems separate DNA over a relatively small area, limiting the resolution of complex samples. RGE is an exception to this, with a useful separation distance up to 20 cm and a maximum gel size of 18 × 20 cm.
The field strength has a profound effect on pulsed field separations and is a compromise between separation time and resolution of a particular size class. Four to six volts/cm is generally required for resolving DNA up to 2000 kb (e.g., S. cerevisiae chromosomes) in a reasonable period of time (e.g., 1-2 days).
However, these field strengths trap and immobilize even bigger DNA in the agarose matrix, and DNA > 3000 kb requires 2 V/cm or less for separation. Pulse time primarily changes the size range of separation. Longer pulse times lead to separation of larger DNA. For example, at 5.4 V/cm, the 1.6 Mb and 2.2 Mb chromosomes from S. cerevisiae separate as a single band with 90-second pulse length.
Increasing the pulse length to 120 seconds resolves these into two bands. Any angle between 96° and 165° produces roughly equivalent separation. The smaller the angle, however, the faster the DNA mobility. And for separating extremely large DNA, 96° to 105° is almost a requirement to get a good separation in the shortest possible time.
The type of agarose also affects DNA separation, with the fastest mobilities and best resolution achieved in gels made of low electroendoosmosis (EEO) agarose. Although most standard electrophoresis grades of agarose are suitable for PFGE, agarose with minimal EEO will provide a faster separation. Several low EEO “pulsed field grades” are available, including Fast Lane and Gold, and Megarose.
The concentration of agarose affects both the resolution and mobility of the DNA. Higher concentrations of agarose yield sharper, but slower moving bands. And the typical concentrations used (0.8-1.2%) represent a tradeoff between speed and resolution. High percentages of low EEO agarose may improve resolution without sacrificing the speed of separation. Because DNA mobility also depends on the separation temperature, the temperature must be constant both during and between runs. Although higher temperatures increase DNA mobility, it does so at the expense of resolution.
Electrophoresis of RNA:
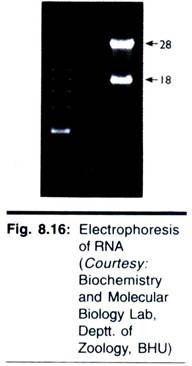
Like that of DNA, electrophoresis of RNA is carried out in agarose gels; and the principle of the separation, based on the size, is the same. Often one requires a rapid method for checking the integrity of RNA immediately following extraction but before deciding whether to process it further. This can be achieved easily by electrophoresis in a 2% agarose gel in about 1 h. Ribosomal RNAs (18 S and 28 S) are clearly resolved and any degradation (seen as smear) or DNA contamination is seen easily.
However, if greater resolution is required, a smaller-pored acrylamide gel is used to enhance resolution, for example, to resolve transfer RNAs (4 S) from 5 S ribosomal RNAs. This can be achieved on a 2.5-5% acrylamide gradient gel with an overnight run. Both these methods involve running native RNA. There will almost certainly be some secondary structure within the RNA molecule owing to intermolecular hydrogen bonding. For this reason native RNA run on gels can be stained and visualised with ethidium bromide.
However, if the study objective is to determine RNA size by gel electrophoresis, the full denaturation of the RNA is needed to prevent hydrogen bond formation within or even between polynucleotides that will otherwise affect the electrophoretic mobility. There are three denaturing agents (formaldehyde, glyoxal and methyl mercuric hydroxide) that are compatible with both RNA and agarose.
Either one of these may be incorporated into the agarose gel and electrophoresis buffer, or the sample is heat denatured in the presence of the denaturant prior to electrophoresis. After heat denaturation, each of these agents forms ad- ducts with the amino groups of guanine and uracil, thereby hydrogen bond reformation at room temperature during electrophoresis.
It is also necessary to run denaturing gels if the RNA is to be blotted and probed, to ensure that the base sequence is available to the probe. Denatured RNA stains only very weakly with ethidium bromide, so acrydine orange is commonly used to visualised RNA or denaturing gels. However, it should be noted that many workers will be using radiolabelled RNA and will, therefore, identify bands by autoradiography. An example of the electrophoresis of RNA is shown in Fig. 8.16.
Technique # 3. Polyacrylamide Gels:
Electrophoresis in acrylamide gels is frequently referred to as PAGE, being an abbreviation for Polyacrylamide gel electrophoresis. Cross-linked polyacrylamide gels are formed from the polymerization of acrylamide monomer in the presence of smaller amounts of N-N-methylenebisacrylamide (normally referred to as bisacrylamide) (Fig. 8.17). Note that bisacrylamide is basically two units of acrylamide molecules linked by a methylene group, and is used as a cross-linking agent.
Acrylamide monomer is polymerized in a head-to-tail fashion into long chains and occasionally a bisacrylamide molecule is built into the growing chains, thus introducing a second site for chain extension. Proceeding in this way a cross-linked matrix of fairly well-defined structure is formed, the polymerization of acrylamide is an example of free radical catalysis, and is initiated by the addition of ammonium per-sulphate and the base N, N, N’, N’-tetra-methylenediamine (TEMED). TEMED catalyses the decomposition of per-sulphate ion to give a free radical (i.e., a molecule with an unpaired electron):
If this free radical is represented as R* (where the dot represents an unpaired electron) and M as an acrylamide monomer molecule, then the polymerization can be represented as follow:
Free radicals are highly reactive because of the presence of an unpaired electron that needs to be paired with another electron to stabilize the molecule. R*, therefore, reacts with M, forming a single bond by sharing its unpaired electron with one from the outer shell of the monomer molecule.
In this way long chains of acrylamide are built up, being cross-linked by the introduction of the occasional bisacrylamide molecule into growing chain oxygen mops up free radicals and, therefore, all gel solutions are normally degassed (the solutions are briefly placed under vacuum to remove loosely dissolved air) prior to use.
The degassing of the gel solution also serves a second purpose. The polymerization of acrylamide is an exothermic reaction (i.e., heat is liberated) and the warming up of the gel as it sets can liberate air bubbles that become trapped in the polymerized gel. The degassing step prevents this possibility.
Photo-polymerisation is an alternative method that can be used to polymerize acrylamide gels. The ammonium per-sulphate and TEMED are replaced by riboflavin and when the gel is poured it is placed in front of a bright light for 2-3 h. Photodecomposition of riboflavin generates a free radical that initiates polymerization.
Acrylamide gels are defined in terms of the total percentage of acrylamide present, and the pore size in the gel can be varied by changing the concentrations of both the acrylamide and bisacrylamide. Acrylamide gels can be made with a content of between 3% and 30% acrylamide.
Thus low percentage gels (e.g., 4%) have large pore sizes and are used, for example, in the electrophoresis of proteins, when free movement of the proteins by electrophoresis is required without any noticeable frictional effect and for another example, in flat-bed isoelectric focusing or the stacking gel system of an SDS-polyacrylamide gel.
Low percentage acrylamide gels are also used to separate DNA. Gels containing between 10% to 20% acrylamide are used in techniques such as SDS-gel electrophoresis, where the smaller pore size now introduces a sieving effect that contributes to the separation of proteins according to their size.
Proteins were originally separated on polyacrylamide gels that were polymerized in glass tubes, approximately 7 mm in diameter and about 10 cm in length. The tubes were easy to load and run, with minimum apparatus requirements. However, only one sample could be run per tube and, because conditions of separation could vary from tube to tube, comparison between different samples was not always accurate.
The later introduction of vertical gel slabs allowed running of up to 20 samples under identical conditions in a single run. Vertical slabs are now used routinely for both analysis of proteins and for the separation of DNA fragments during DNA sequence analysis. Although some workers prepare their own acrylamide gels, others purchase commercially available ready-made gels for techniques such as SDS-PAGE, native gels and isoelectric focusing (IEF).
Technique # 4. Sodium Dodecyl Sulphate-Polyacrylamide Gel Electrophoresis:
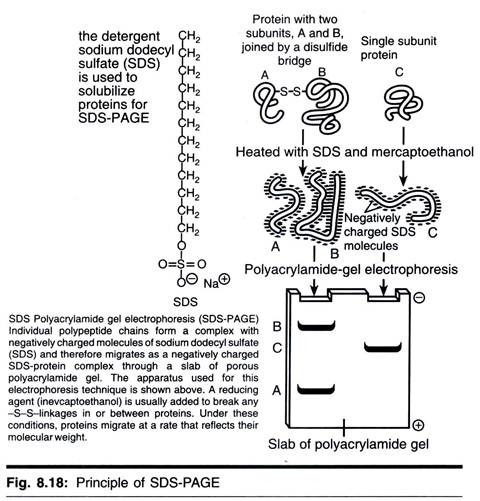
SDS-polyacrylamide gel electrophoresis (SDS-PAGE) is the most widely used method for analyzing protein mixtures qualitatively. It is particularly useful for monitoring protein purification and, as the method is based on the separation of proteins according to size, it can also be used to determine the relative molecular mass of proteins. SDS (CH3-(CH2)10-CH2OSO3-Na+) is an anionic detergent.
Samples to be run on SDS-PAGE are firstly boiled for 5 min in sample buffer containing β- mercaptoethanol and SDS. The mecaptoethnol reduces any disulphide bridges present that are holding together the protein tertiary structure, and the SDS binds strongly to, and denatures, the protein. Each protein in the mixture is, therefore, fully denatured by this treatment and opens up into a rod-shaped structure with a series of negatively charged SDS molecules along the polypeptide chain.
On average, one SDS molecule binds for every two amino acid residues. The original native charge on the molecule is, therefore, fully swamped by the negatively charged SDS molecules. The rod-like structure remains, as any rotation that tends to fold up the protein chain would result in repulsion between negative charges on different parts of the protein chain, returning the conformation back to rod-shape.
The sample buffer also contains an ionisable tracking dye, usually bromophenol blue, that allows the electrophoretic run to be monitored, and sucrose or glycerol, which gives the sample solution density thus allowing the sample to settle easily through the electrophoresis buffer to bottom when injected into the loading well.
Before loading to gel the protein samples are lysed to denature them by boiling them in lysis buffer for 10 min. Lysis buffer contains buffer to maintain pH along with glycerol so as to make the protein heavy to properly settle in wells. Lysis buffer also have SDS to impart negative charge, DTT or β-mercaptoethanol to reduce the disulphide bonds in proteins.
Once the samples are all loaded, a current is passed through the gel. The samples to be separated are not in fact loaded directly into the main separating gel. When the main separating gel (normally about 5 cm long) has been poured between the glass plates and allowed to set, a shorter (approximately 0.5 cm) stacking gel is poured on top of the separating gel and it is into this gel that the wells are formed and the proteins loaded.
The purpose of this stacking gel is to concentrate the protein sample into a sharp band before it enters the main separating gel. This is achieved by utilizing the differences in ionic strength and pH between the electrophoresis buffer and the stacking gel buffer and involves a phenomenon known as isotachophoresis.
The stacking gel has a very large pore size (4% acrylamide), which allows the proteins to move freely and concentrate, or stack, under the effect of the electric field. The band-sharpening effect relies on the fact that negatively charged glycinate ions (in the electrophoresis buffer) have lower electrophoretic mobility than do the protein—SDS complexes, which, in turn, have lower mobility than the chloride ions (CI–) of the loading buffer and the stacking gel buffer.
When the current is switched on, all the ionic species have to migrate at the same speed as CI– only if they are in a region of high field strength. Field strength is inversely proportional to conductivity, which is proportional to concentration. The result is that the three species of interest adjust their concentration so that [CI–] > [protein-SDS] > [glycinate].
There is only a small quantity of protein-SDS complexes, so they concentrate in a very tight band between glycinate and CI– boundaries. Once the gycinate reaches the separating gel it becomes more fully ionized in the higher pH environment and its mobility increases. (The pH of the stacking gel is 6.8, that of the separating gel is 8.8).
Thus, the interface between glycinate and CI– leaves behind the protein-SDS complex’s, which are left to electrophorese at their own rates. The negatively charged protein-SDS complexes now continue to move towards the anode, and as because they have the same charge per unit length, they travel into the separating gel under the applied electric field with the same mobility.
However, as they pass through the separating gel the proteins separate, owing to the molecular sieving properties of the gel. Quite simply the smaller the protein the more easily it can pass through the pores of the gel, whereas large proteins are successively retarded by frictional resistance due to the sieving effect of the gels. Being a small molecule, the bromophenol blue dye is totally un-retarded and, therefore, indicates the electrophoresis front.
When the dye reaches the bottom of the gel, the current is turned off, and the gel is removed from between the glass plates and shaken in an appropriate stain solution and then washed in destain solution. The destain solution removes unbound background dye from the gel, leaving stained proteins visible as blue bands on a clear background.
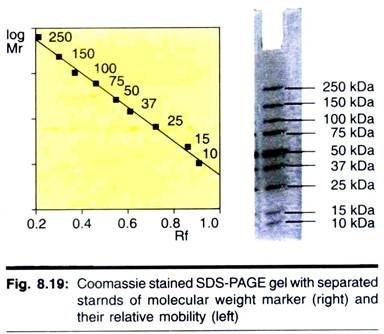
A typical minigel would take about 1 h to prepare and set, 40 min to run at 200 V and have a 1 h staining time with Coomassie Brilliant Blue. Upon de-staining, strong protein bands would be seen in the gel within 10-20 min, but overnight de-staining is needed to completely remove all background stain. Vertical slab gel are invariably run, since this allows up to 10n different sample to be loaded onto a single gel. A typical SDS-polyacrylamide gel is shown in Fig. 8.19.
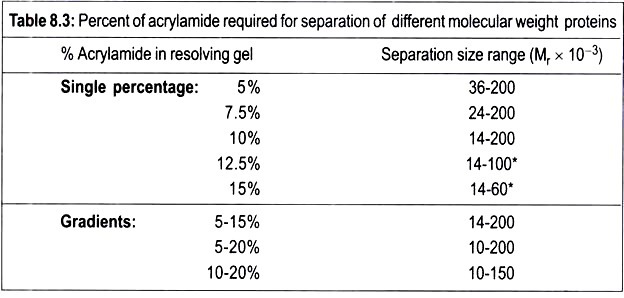
Typically, the separating gel used is a 15% polyacrylamide gel. This gives a gel a certain pore size in which proteins of relative molecular mass (Mr) 10,000 move through the gel relatively unhindered, whereas proteins of Mr 10, 00,000 can only just enter the pores of this gel. Gels of 15% polyacrylamide are, therefore, useful for separating proteins in the range Mr 1, 00,000 to 10,000.
However, a protein of Mr 1, 50,000, for example, would be unable to enter a 15% gel. In this case a larger-pored gel (e.g., a 10% or even 7.5% gel) would be used so that the protein could now enter the gel and be stained and identified. It is obvious; therefore, that the choice of gel to be used depends on the size of the proteins in the range of different percentage acrylamide gel is shown in Table 8.3.
This shows, for example, that in a 10% polyacrylamide gel proteins greater than 200 kDa in mass cannot enter the gel, whereas proteins with relative molecular mass (Mr) in the range 200,000 to 15,000 will separate. Proteins of Mr 15,000 are too small to experience the sieving effect of the gel matrix, and all run together as a single band at the electrophoresis front.
The Mr of a protein can be determined by comparing its mobility with those of a number of standard proteins of known Mr that are run on a same gel. Plotting a graph of distance moved against log Mr for each of the standard proteins, a calibration curve can be constructed. The distance moved by the protein of unknown Mr is then measured, and then its log Mr and hence Mr can be determined from the calibration curve.
SDS-gel electrophoresis is often used after each step of a purification protocol to assess the purity or otherwise of the sample. A pure protein should give a single band on an SDS-polyacrylamide gel, unless the molecule is made up of two unequal subunits. In the latter case, two bands, corresponding to the two subunits, will be seen.
Since only sub-microgram amounts of the protein are needed for the gel, very little material is used in this form of purity assessment and at the same time a value for the relative molecular mass of the protein can be determined on the same gel run (as described above), with no more material being used.
Technique # 5. Native (Buffer) Gels:
While SDS-PAGE is the most frequently used gel system for studying proteins, the method is of no use if one is aiming to detect a particular protein (often an enzyme) on the basis of its biological activity, because the protein (enzyme) is denatured by SDS-PAGE procedure. In this case it is necessary to use non-denaturing conditions.
In native or buffer gels, polyacrylamide gels are again used (normally a 7.5% gel) but the SDS is absent and the proteins are not denatured prior to loading. Since all the proteins in this sample being analyzed carry their native charge at the pH of the gel (normally pH 8.7), proteins separate according to their different electrophoretic mobilities and the sieving effects of the gel.
It is, therefore, not possible to predict the behaviour of a given protein in a buffer gel but, because of the range of different charges and the sizes of the proteins in a given protein mixture, good resolution is achieved. The enzyme of interest can be identified by incubating the gel in an appropriate substrate solution such that a coloured product is produced at the site of the enzyme.
An alternative method for enzyme detection is to include the substrate in an agarose gel that is poured over the acrylamide gel and allowed to set. Diffusion and interaction of enzyme and substrate between the two gels result in colour formation at the site of the enzyme. Often, duplicate samples will be run on the gel, the gel cut in half and one half stained for activity, the other for total protein. In this way the total protein content of the sample can be analysed and the particular band corresponding to the enzyme identified by reference to the activity stain gel.
Technique # 6. Gradient Gels:
This is again a polyacrylamide gel system, but instead of running a slab gel of uniform pore size throughout (e.g., a 15% gel) a gradient gel is formed, where the acrylamide concentration varies uniformly from typical 5% at the top of the gel to 25% acrylamide at the bottom of the gel. The gradient is formed via a gradient mixer and run down between the glass plates of a slab gel.
The higher percentage acrylamide (e.g., 25%) is poured between the glass plates first and a continuous gradient of decreasing acrylamide concentration follows. Therefore, at the top of the gel there is a large pore size (5% acrylamide) but as the sample moves down the gel the acrylamide concentration slowly increases and the pore size correspondingly decreases.
Gradient gels are normally run as SDS gels with a staking gel. There are two advantages to running gradient gels. First, a much greater range of protein Mr values can be separated than on a fixed-percentage gel. In a complex mixture, very low molecular weight proteins travel freely through the gel to begin with, and start to resolve when they reach the smaller pore sizes towards the lower part of the gel.
Much larger proteins, on the other hand, can still enter the gel but start to separate immediately due to the sieving effect of the gel. The second advantage of the gradient gels is that proteins with very similar Mr values may be resolved, although they cannot otherwise be resolved in fixed percentage gels. As each protein moves through the gel the pore sizes become smaller until the protein reaches its pore size limit.
The pore size in the gel is now too small to allow passage of the protein, and the protein sample stacks up at this point as a sharp band. A similar-sized protein, but with slightly lower Mr, will be able to travel a little further through the gel before reaching its pore size limit, at which point it will form a sharp band. These two proteins, of slightly different Mr values, therefore, separate as two close sharp bands.
Technique # 7 Capillary Electrophoresis (CE):
The process of electrophoresis is defined as ‘the differential movement or migration of ions by attraction or repulsion in an electric field’. In practical terms, a positive (anode) and negative (cathode) electrode are placed in a solution containing ions. Then, when a voltage is applied across the electrodes, solute ions of different charge, i.e., anions (negative) and cations (positive), will move through the solution towards the electrode of opposite charge. Capillary electrophoresis, then, is the technique of performing electrophoresis in buffer-filled, narrow-bore capillaries, normally from 25 to 100 mm in internal diameter (ID).
Instrumentation:
The instrumentation required for CE is remarkably simple in design, as Fig. 8.20 illustrates. The ends of a capillary are placed in separate buffer reservoirs, each containing an electrode connected to a high-voltage power supply capable of delivering up to 30 kV. The sample is injected onto the capillary by temporarily replacing one of the buffer reservoirs (normally at the anode) with a sample reservoir and applying either an electric potential or external pressure for a few seconds.
After replacing the buffer reservoir, an electric potential is applied across the capillary and the separation is performed. Optical (UV-visible or fluorometric) detection of separated analytes can be achieved directly through the capillary wall near the opposite end (normally near the cathode). CE is very suited to automation, and the arrangement of commercial CE instruments will seem familiar to those with knowledge of modern HPLC.
Basic features of a CE instrument include an auto-sampler, a detection module, a high-voltage power supply, the capillary and, of course, a computer to control everything. So, if we consider that the power supply is equivalent to an HPLC pump and the capillary is equivalent to a column, the instrumentation is completely analogous. This is especially so as the software packages used to control most commercial CE instruments are based heavily on existing HPLC software.
Electro Osmotic Flow (EOF):
A vitally important feature of CE is the bulk flow of liquid through the capillary. This is called the electro osmotic flow and is caused as follows. An uncoated fused-silica capillary tube is typically used for CE. The surface of the inside of the tube has ionisable silanol groups, which are in contact with the buffer during CE. These silanol groups readily dissociate, giving the capillary wall a negative charge.
Therefore, when the capillary is filled with buffer, the negatively charged capillary wall attracts positively charged ions from the buffer solution, creating an electrical double layer and a potential difference (zeta potential) close to the capillary wall, as described according to Stern’s model in Fig. 8.21.
Stern’s model for an electrical double layer includes a rigid layer of adsorbed ions and a diffuse layer, in which ion diffusion may occur by thermal motion. The zeta potential is the potential at any given point in the double layer and decreases exponentially with increasing distance from the capillary wall surface.
When a voltage is applied across the capillary, cations in the diffuse layer are free to migrate towards the cathode, carrying the bulk solution with them. The result is a net flow in the direction of the cathode, with a velocity described by
vEOF = (ɛ0ɛξ / 4πη)E,
where ɛ0 is the dielectric constant of a vacuum, s is the dielectric constant of the buffer, ξ is the zeta potential, η is the viscosity of the buffer and E is the applied electric field. The terms enclosed in brackets equate to the mobility of the EOF (µEOF).
The relationship between EOF mobility and EOF velocity is analogous to that between electrophoretic mobility and migration velocity. Indeed, the units for EOF mobility are the same as those for electrophoretic mobility.
Factors Affecting EOF Mobility:
The main variables affecting EOF mobility are the dielectric constant and viscosity of the buffer and the size of the zeta potential. The use of buffer additives and/or other modifications of the buffer composition may influence the dielectric constant and viscosity of the buffer. Buffer viscosity will also depend on the temperature at which the CE separation is performed.
Zeta Potential:
The zeta potential is proportional to the charge density on the capillary wall, which itself is pH dependent. Therefore, EOF mobility will vary according to the buffer pH, such that at high pH the EOF mobility will be significantly greater than at low pH. Fig. 8.22 depicts the variation of EOF mobility with pH for a typical fused-silica capillary.
Above pH 9, silanols are completely ionised and the EOF mobility is at its greatest. Below pH 4, the ionisation of silanols is low and the EOF mobility is insignificant. The zeta potential will also depend upon the ionic strength of the buffer, because as ionic strength increases, the double layer will become compressed, which results in a decreased zeta potential and reduced EOF mobility.
At pH>7, the EOF mobility is sufficient to ensure the net migration of most ions towards the cathode, regardless of their charge. Therefore, the observed migration velocity of a solute may not be directly related to its electrophoretic mobility. Instead, it is related to a combination of both its electrophoretic mobility and the EOF mobility. Therefore, a solute’s apparent electrophoretic mobility (µa) that is calculated from its observed migration velocity, is the vector sum of its real (or effective) electrophoretic mobility (µe) and the EOF mobility (µEOF), i.e.,
Ma = Me + µEOF.
Since samples are normally introduced at the anode and EOF moves from the anode to the cathode, cations have positive µe, neutrals have zero µe and anions have negative µe. In other words, cations migrate faster than the EOF and anions migrate more slowly than the EOF. Neutrals migrate with the same velocity as the EOF.
Flow Profile in CE:
A further key feature of EOF is that it has flat flow profile, which is shown in figure 8.23, alongside the parabolic flow profile generated by an external pump, as used for HPLC. EOF has a flat profile because its driving force (i.e., charge on the capillary wall) is uniformly distributed along the capillary, which means that no pressure drops are encountered and the flow velocity is uniform across the capillary.
This contrasts with pressure-driven flow, such as in HPLC, in which frictional forces at the column walls cause a pressure drop across the column, yielding a parabolic or laminar flow profile. The flat profile of EOF is important because it minimizes zone broadening, leading to high separation efficiencies that allow separations on the basis of mobility differences as small as 0.05%.
The Electropherogram:
The data output from CE is presented in the form of an electropherogram, which is analogous to a chromatogram. An electropherogram is a plot of migration time vs. detector response. The detector response is usually concentration dependent, such as UV-visible absorbance or fluorescence. The appearance of a typical electropherogram is shown in Fig. 8.24 for the separation of a three component mixture of cationic, neutral and anionic solutes.
Technique # 8. Cellulose Acetate Electrophoresis:
Although one of the older methods, cellulose acetate electrophoresis still has a number of applications, in particular it has retained a use in the clinical analysis of serum samples. Cellulose acetate has the advantage over paper, in that it is a much more homogeneous medium, with a uniform pore size, and does not absorb proteins in the way that paper does.
There is, therefore, much less trialing of protein bands and resolution is better, although nothing like as good as that activated with polyacrylamide gels. The method is, however, far simpler to set up and run. Single samples are normally run on cellulose acetate strips (2.5 cm × 12 cm), although multiple samples are frequently run on wider sheets.
The cellulose acetate is first wetted in electrophoresis buffer (pH 8.6 for serum samples) and the sample (1-2 mm3) loaded as a 1 cm wide strip about one-third of the way along the strip. The ends of the strip make contact with the electrophoresis buffer tanks via a filter paper wick that overlaps the end of the cellulose acetate strip, and the electrophoresis conducted at 6-8 V cm-1 for about 3 h. Following electrophoresis, the strip is stained for protein, de-stained, and the bands visualised.
Enzymes can easily be detected, in samples electrophoresed on cellulose acetate, by using the zymogram technique. The cellulose strip is laid on a strip of filter paper soaked in buffer and substrate. After an enzyme appropriate incubation period, the strips are peeled apart and the paper zymogram treated accordingly to detect enzyme product; hence, it is possible to identify the position of the enzyme activity on the original strip.
An alternative approach to detecting and semi-quantifying any particular protein on a strip to treat the strip as the equivalent of a protein blot and to probe for the given protein using primary antibody and the enzyme-linked secondary antibody. Substrate colour development indicates the presence of a particular protein and the amount of colour developed in a given time is a semi-quantitative measure of the amount of protein.
Thus, for example, large numbers of serum samples can be run on a wide sheet, the sheet is probed using antibodies, and elevated levels of a particular protein identified in certain samples by increased levels of colour development in these samples.
Technique # 9. Isoelectric Focusing and Two-Dimensional Gel Electrophoresis:
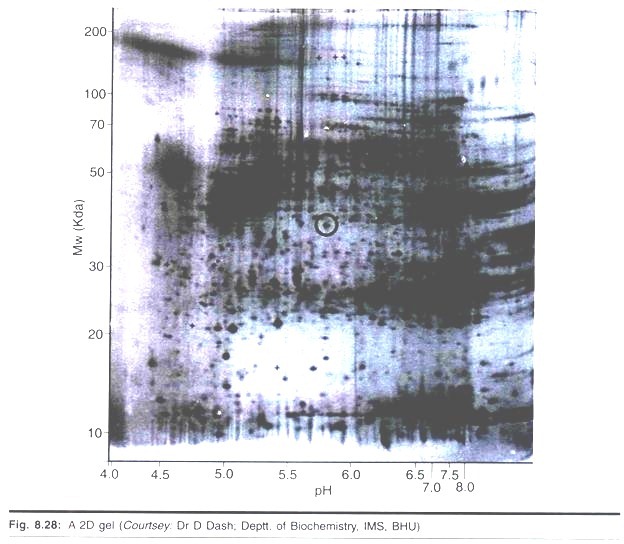
Two-dimensional electrophoresis (2-D electrophoresis) is a powerful and widely used method for the analysis of complex protein mixtures extracted from cells, tissues, or other biological samples. This technique sorts proteins according to two independent properties in two discrete steps: the first-dimension step, isoelectric focusing (IEF), separates proteins according to their isoelectric points (pi); the second-dimension step, SDS-polyacrylamide gel electrophoresis (SDS-PAGE), separates proteins according to their molecular weights (Mr, relative molecular weight).
Each spot on the resulting two-dimensional array corresponds to a single protein species in the sample. Thousands of different proteins can thus be separated, and information such as the protein pi, the apparent molecular weight, and the amount of each protein are obtained.
Two-dimensional electrophoresis was first introduced by P. H. O’Farrell and J. Klose in 1975. In the original technique, the first-dimension separation was performed in carrier ampholyte-containing polyacrylamide gels cast in narrow tubes. A. Gorg and colleagues developed the currently employed 2-D technique, where carrier ampholyte-generated pH gradients have been replaced with immobilized pH gradients and tube gels replaced with gels supported by a plastic backing.
A large and growing application of 2-D electrophoresis is “proteome analysis.” The analysis involves the systematic separation, identification, and quantification of many proteins simultaneously from a single sample. Two-dimensional electrophoresis is used in this technique due to its unparalleled ability to separate thousands of proteins simultaneously.
Two-dimensional electrophoresis is also unique in its ability to detect post- and co-translational modifications, which cannot be predicted from the genome sequence. Applications of 2-D electrophoresis include proteome analysis, cell differentiation, and detection of disease markers, monitoring therapies, drug discovery, cancer research, purity checks, and micro-scale protein purification.
The 2-D process begins with sample preparation. Proper sample preparation is absolutely essential for a good 2-D result. The next step in the 2-D process is IPG (Isoelectric pH gradient) strip rehydration. IPG strips are provided dry and must be rehydrated with the appropriate additives prior to IEF (Immunoelectrophoresis).
First-dimension IEF is performed on a flatbed system at very high voltages with active temperature control. Next, strip equilibration in SDS-containing buffer prepares the sample for the second-dimension separation. Following equilibration, the strip is placed on the second-dimension gel for SDS-PAGE. The final steps are visualization and analysis of the resultant two-dimensional array of spots.
In summary, the experimental sequence for 2-D electrophoresis is:
1. Sample preparation
2. IPG strip rehydration
3. IEF
4. IPG strip equilibration
5. SDS-PAGE
6. Visualization
7. Analysis.
Sample Preparation:
Due to the great diversity of protein sample types and origins, only general guidelines for sample preparation are provided in this section. The optimal procedure must be determined empirically for each sample type. Ideally, the process will result in the complete solubilization, disaggregation, denaturation, and reduction of the proteins in the sample.
When developing a sample preparation strategy, it is important to have a clear idea of what is desired in the final 2-D result. Is the goal to view as many proteins as possible, or is only a subset of the proteins in the sample of potential interest? Which is more important – complete sample representation, or a clear, reproducible pattern?
Additional sample preparation steps can improve the quality of the final result, but each additional step can result in the selective loss of protein species. The trade-off between improved sample quality and complete protein representation must, therefore, be carefully considered.
In order to characterize specific proteins in a complex protein mixture, the proteins of interest must be completely soluble under electrophoresis conditions. Different treatments and conditions are required to solubilize different types of protein samples; some proteins are naturally found in complexes with membranes, nucleic acids, or other proteins, some proteins form various nonspecific aggregates, and some proteins precipitate when removed from their normal environment.
The effectiveness of solubilization depends on the choice of cell disruption method, protein concentration and dissolution method, choice of detergents, and composition of the sample solution. If any of these steps are not optimized for a particular sample, separations may be incomplete or distorted and information may be lost.
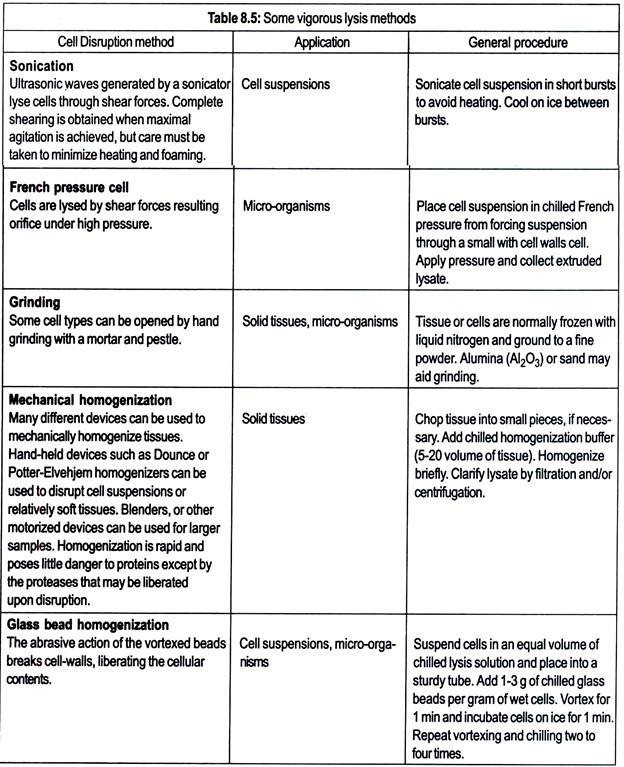
To fully analyze all intracellular proteins, the cells must be effectively disrupted. Choice of disruption method depends on whether the sample is from cells, solid tissue, or other biological material and whether the analysis is targeting all proteins or just a particular subcellular fraction. Both gentle and vigorous lysis methods are discussed below.
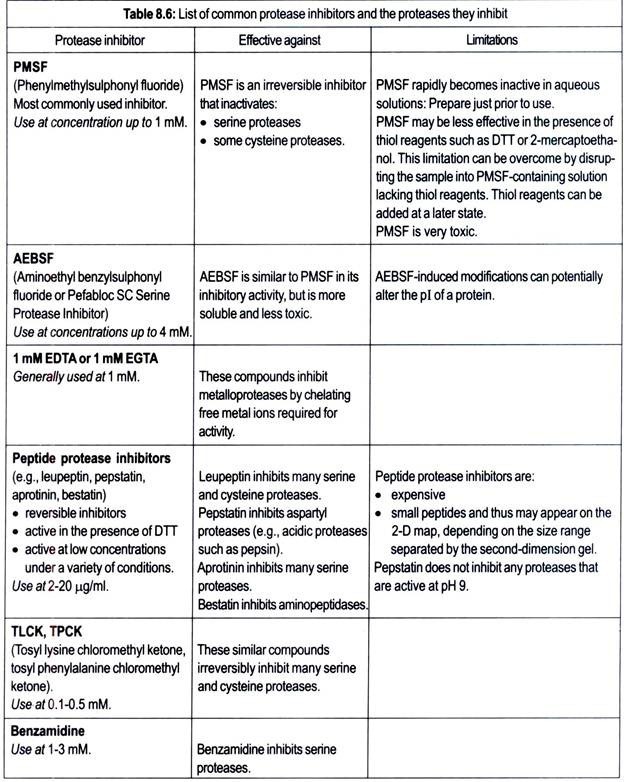
Proteases may be liberated upon cell disruption. Proteolysis greatly complicates analysis of the 2-D result, thus the protein sample should be protected from proteolysis during cell disruption and subsequent preparation. Proteases are less active at lower temperatures, so sample preparation at as low a temperature as possible is recommended.
In addition, proteolysis can often be inhibited by preparing the sample in the presence of tris base, sodium carbonate, or basic carrier ampholyte mixtures. These approaches alone are often sufficient protection against proteolysis. However, some proteases may retain some activity even under these conditions. In these cases, protease inhibitors may be used.
Individual protease inhibitors are only active against specific classes of proteases, so it is usually advisable to use a combination of protease inhibitors. Broad range protease inhibitor “cocktails” are available from a number of commercial sources. Table 8.6 lists common protease inhibitors and the proteases they inhibit.
If only a subset of the proteins in a tissue or cell type is of interest, pre-fractionation can be employed during sample preparation. If proteins from one particular subcellular compartment (e.g., nuclei, mitochondria, plasma membrane) are desired, the organelle of interest can be purified by differential centrifugation or other means prior to solubilization of proteins for 2-D electrophoresis.
The sample can also be pre-fractionated by solubility under different extraction conditions prior to 2-D electrophoresis. Precipitation of the proteins in the sample and removal of interfering substances are optional steps. The decision to employ these steps depends on the nature of the sample and the experimental goal. Precipitation procedures, which are used both to concentrate the sample and to separate the proteins from potentially interfering substances, are described below.
No precipitation technique is completely efficient and some proteins may not readily re-suspend following precipitation. Thus, employing a precipitation step during sample preparation can alter the protein profile of a sample. Precipitation and re-suspension should be avoided if the aim of a 2- D experiment is complete and accurate representation of all the proteins in a sample.
If sample preparation requires precipitation, typically only one of the following precipitation techniques is employed:
1. Ammonium sulphate precipitation:
(“Salting out”) In the presence of high salt concentrations, proteins tend to aggregate and precipitate out of solution. Many potential contaminants (e.g., nucleic acids) will remain in solution.
2. TCA precipitation:
TCA (trichloroacetic acid) is a very effective protein precipitant.
3. Acetone precipitation:
This organic solvent is commonly used to precipitate proteins. Many organic-soluble contaminants (e.g., detergents, lipids) will remain in solution.
4. Precipitation with TCA in acetone:
The combination of TCA and acetone is commonly used to precipitate proteins during sample preparation for 2-D electrophoresis and is more effective than either TCA or acetone alone.
5. Precipitation with ammonium acetate in methanol following phenol extraction:
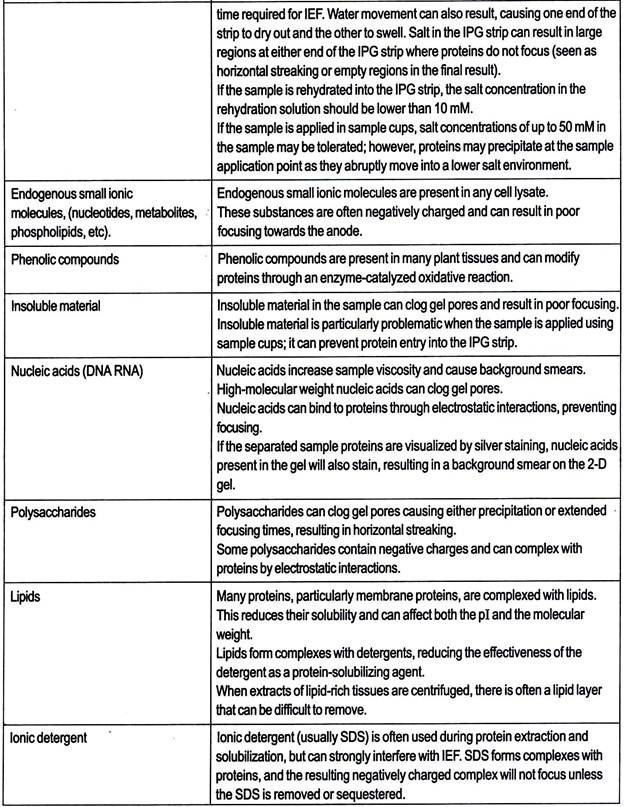
This technique has proven useful with plant samples containing high levels of interfering substances. Non-protein impurities in the sample can interfere with separation and subsequent visualization of the 2-D result, so sample preparation can include steps to rid the sample of these substances. Table 8.7 lists contaminants that affect 2-D results and techniques for their removal.
In general, it is advisable to keep sample preparation as simple as possible. A sample with low protein concentrations and a high salt concentration, for example, could be diluted normally and analyzed, or desalted, then concentrated by lyophilization, or precipitated with TCA and ice-cold acetone and re-solubilized with rehydration solution.
The first option of simply diluting the sample with rehydration solution may be sufficient. If problems with protein concentration or interfering substances are otherwise insurmountable, then precipitation or removal steps may be necessary.
The composition of the sample solution is particularly critical for 2-D because solubilisation treatments for the first-dimension separation must not affect the protein pi, nor leave the sample in a highly conductive solution. In general, concentrated urea’s as well as one or more detergents are used. Sample solution composition is discussed herewith.
These always include urea and one or more detergents. Complete denaturation ensures that each protein is present in only one configuration and that aggregation and intermolecular interaction are avoided. The lysis solution, which contains urea and the zwitterionic detergent CHAPS, has been found to be effective for solubilizing a wide range of samples.
Reductant and IPG buffer are also frequently added to the sample solution to enhance sample solubility. IEF performed under denaturing conditions gives the highest resolution and the cleanest results. Urea, a neutral chaotrope, is used as the denaturant in the first- dimension of 2-D electrophoresis. Urea solubilizes and unfolds most proteins to their fully random conformation, with all ionizable groups exposed to solution.
Recently, the use of thiourea in addition to urea has been found to further improve solubilization, particularly of membrane proteins. A non-ionic or zwitterionic detergent is always included in the sample solution to ensure complete sample solubilization and to prevent aggregation through hydrophobic interactions. Originally, either of two similar non-ionic detergents, NP-40 or Triton X-100, was used.
When difficulties in achieving full sample solubilization are encountered, the anionic detergent SDS can be used as a solubilizing agent. SDS is a very effective protein solubilizer, but as because it is charged and forms complexes with proteins, it cannot be used as the sole detergent for solubilizing samples for 2-D electrophoresis.
A widely used method for negating the interfering effect of SDS is dilution of the sample into a solution containing an excess of CHAPS, Triton X-100, or NP-40. The final concentration of SDS should be 0.25% or lower and the ratio of the excess detergent to SDS should be at least 8:1.Reducing agents are frequently included in the sample solution to break any disulphide bonds present and to maintain all proteins in their fully reduced state.
The most commonly used reductant is dithiothreitol (DTT) at concentrations ranging from 20 to 100 mM. Dithioerythreitol (DTE) is similar to DTT and can also be used as a reducing agent. Originally, 2-mercaptoethanol was used as a reductant, but higher concentrations of the reductant are required and inherent impurities may result in artifacts. More recently, the non-thiol reductant tributyl phosphine (TBP), at a concentration of 2 mM, has been used as a reductant for 2-D samples.
However, due to the limited solubility and instability of TBP in solution, a thiol reductant such as DTT should be used to maintain proteins in their reduced state through rehydration and first-dimension IEF, if TBP is employed as a reductant during sample preparation. Carrier ampholytes or IPG buffer (up to 2% (v/v)) can be included in the sample solution.
They enhance protein solubility by minimizing protein aggregation due to charge-charge interactions. In some cases, buffers or bases (e.g., 40 mM Tris base) are added to the sample solution. This is done when basic conditions are required for full solubilization or to minimize proteolysis. However, introduction of such ionic compounds can result in first-dimension disturbances.
Bases or buffers should be diluted to 5 mM or lower prior to loading the sample onto first-dimension IEF. A sample should remain in sample solution at room temperature for at least 30 min for full denaturation and solubilization prior to centrifugation and subsequent sample application.
Heating of the sample in the presence of detergent can aid in solubilization, but should only be done prior to the addition of urea. Sonication helps speed up solubilization, particularly from material that is otherwise difficult to re-suspend.
First-dimension Isoelectric Focusing (IEF):
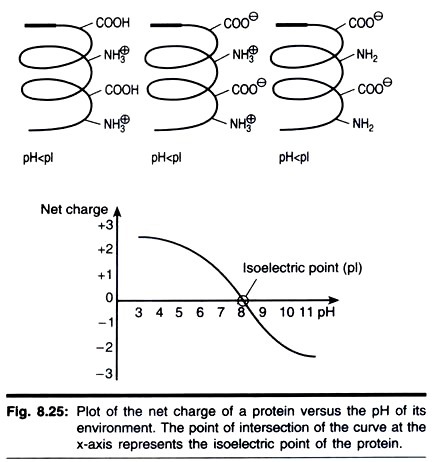
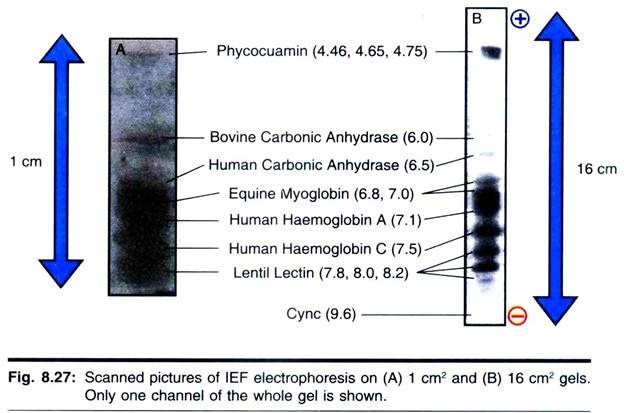
A useful first-dimension separation requires selecting a first-dimension pH range appropriate for the sample, as well as a suitable sample application method. IEF is an electrophoretic method that separates proteins according to their isoelectric points (pi). Proteins are amphoteric molecules; they carry either positive, negative, or zero net charge, depending on the pH of their surroundings (Fig. 8.25).
The net charge of a protein is the sum of all the negative and positive charges of its amino acid side- chains and amino- and carboxyl-ter- mini. The isoelectric point (pi) is the specific pH at which the net charge of the protein is zero. Proteins are positively charged at pH values below their pi and negatively charged at pH values above their pi. If the net charge of a protein is plotted versus the pH of its environment, the resulting curve intersects the x-axis at the isoelectric point (Fig. 8.25).
The presence of a pH gradient is critical to the IEF technique. In a pH gradient, under the influence of an electric field, a protein will move to the position in the gradient where its net charge is zero. A protein with a positive net charge will migrate toward the cathode, becoming progressively less positively charged as it moves through the pH gradient until it reaches its pi.
A protein with a negative net charge will migrate toward the anode, becoming less negatively charged until it also reaches zero net charge. If a protein should diffuse away from its pi, it immediately gains charge and migrates back. This is the focusing effect of IEF, which concentrates proteins at their pls and allows proteins to be separated on the basis of very small charge differences.
The resolution is determined by the slope of the pH gradient and the electric field strength. IEF is, therefore, performed at high voltages (typically in excess of 1 000 V). When the proteins have reached their final positions in the pH gradient, there is very little ionic movement in the system, resulting in a very low final current (typically below 1 mA). IEF of a given sample in a given electrophoresis system is generally performed for a constant number of volt-hours.
The original method for first-dimension IEF depended on carrier ampholyte-generated pH gradients in polyacrylamide gel rods in tubes. Carrier ampholytes are small, soluble, amphoteric molecules with a high buffering capacity near their pi. Commercial carrier ampholyte mixtures are comprised of hundreds of individual polymeric species with pis spanning a specific pH range.
When a voltage is applied across a carrier ampholyte mixture, the carrier ampholytes with the highest pi (and the most negative charge) move toward the anode and the carrier ampholytes with the lowest pi (and the most positive charge) move toward the cathode. The other carrier ampholytes align themselves between the extremes, according to their pis, and buffer their environment to the corresponding pHs. The result is a continuous pH gradient.
Although this basic method has been used in hundreds of 2-D electrophoresis studies, it has several limitations that have prevented its more widespread application:
i. Carrier ampholytes are mixed polymers that are not well characterized and suffer from batch-to-batch manufacturing variations. These variations reduce the reproducibility of the first-dimension separation.
ii. Carrier ampholyte pH gradients are unstable and have a tendency to drift, usually toward the cathode, over time. Gradient drift adversely affects reproducibility by introducing a time variable. Gradient drift also causes a flattening of the pH gradient at each end, particularly above pH 9, rendering the 2-D technique less useful at pH extremes.
iii. The soft polyacrylamide tube gels have low mechanical stability. The gel rods may stretch or break, affecting reproducibility. Results are often dependent on the skill of the operator.
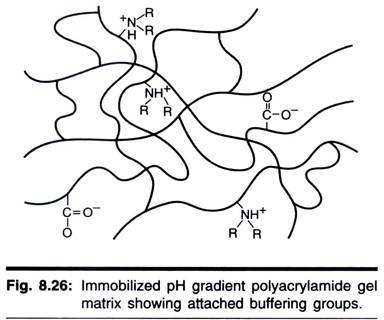
As a result of the limitations and problems with carrier ampholyte pH gradients, immobilized pH gradients were developed .An immobilized pH gradient (IPG) is created by covalendy incorporating a gradient of acidic and basic buffering groups into a polyacrylamide gel at the time it is cast. The buffers are a set of well-characterized molecules, each with a single acidic or basic buffering group linked to an acrylamide monomer.
The general structure of immobilized reagents is:
R = weakly acidic or basic buffering group. Immobilized pH gradients are formed using two solutions, one containing a relatively acidic mixture of acrylamide buffers and the other containing a relatively basic mixture. The concentrations of the various buffers in the two solutions define the range and shape of the pH gradient produced.
Both solutions contain acrylamide monomers and catalysts. During polymerization, the acrylamide portion of the buffers copolymerizes with the acrylamide and bisacrylamide monomers to form a polyacrylamide gel. Fig. 8.26 is a graphic representation of the polyacrylamide matrix with attached buffering groups.
IPG strips must be rehydrated prior to IEF. The IPG strips are rehydrated in a solution containing the necessary additives and, optionally, the sample proteins. IEF is performed by gradually increasing the voltage across the IPG strips to at least 3500 V and maintaining this voltage for at least several thousand volt-hours.
After IEF, the IPG strips are equilibrated in equilibration solution and applied onto flatbed or vertical SDS-polyacrylamide gels. When IPG strips are used for the first-dimension separation, the resultant 2-D maps are superior in terms of resolution and reproducibility. IPG strips are a marked improvement over tube gels with carrier ampholyte-generated pH gradients.
Ready-made IPG strips are commercially available. It is always advisable to choose shorter strips for fast screening or when the most abundant proteins are of interest and to use longer strips for maximal resolution and loading capacity.
Sample can be applied either by including it in the rehydration solution (rehydration loading) or by applying it directly to the rehydrated IPG strip via sample cups, sample wells, or paper bridge. Usually rehydration loading is preferable.
Advantages to this mode of application include the following:
i. Rehydration loading allows larger quantities of protein to be loaded and separated.
ii. Rehydration loading allows more dilute samples to be loaded.
iii. Because there is no discrete application point, this method eliminates the formation of precipitates at the application point that often occurs when loading with sample cups.
iv. The rehydration loading method is technically simpler, avoiding problems of leakage that can occur when using sample cups.
v. There are, however, cases when one might prefer to load the sample following rehydration, immediately prior to IEF, e.g., if proteolysis or other protein modifications are a concern, overnight rehydration with sample may not be desired.
The IPG strips are rehydrated in the especially designed rehydration tray or cassette. Rehydration solution, which may or may not include the sample, is applied to the reservoir slots of the rehydration tray and then the IPG strips are soaked individually.
The choice of the most appropriate rehydration solution for the sample will depend on its specific protein solubility requirements, but a typical solution generally contains urea, non-ionic or zwitterionic detergent, dithiothreitol (DTT), Pharmalytes. The sample may also be included. The role of each component is described below, as well as the recommended concentration range.
Urea solubilizes and denatures proteins, unfolding them to expose internal ionizable amino acids. Commonly 8 M urea is used, but the concentration can be increased to 9 M or 9.8 M, if necessary for complete sample solubilization. Thiourea, in addition to urea, can be used to further improve protein solubilization.
Detergent solubilizes hydrophobic proteins and minimizes protein aggregation. The detergent must have zero net charge—use only non-ionic and zwitterionic detergents. CHAPS, Triton X-100, or NP-40 in the range of 0.5 to 4% are most commonly used.
Reductant cleaves disulphide bonds to allow proteins to unfold completely. DTT or DTE, (20 to 100 mM) are commonly used. 2-Mercaptoethanol is not recommended, because higher concentrations are required, and impurities may result in artifacts. Tributyl phosphine (TBP) is not recommended as reductant for IEF due to its low solubility and poor stability in rehydration solution. Reductants should be added directly before use.
Pharmalyte (carrier ampholyte mixtures) improve separations, particularly with high sample loads. Carrier ampholyte mixtures enhance protein solubility and produce more uniform conductivity across the pH gradient without disturbing IEF or affecting the shape of the gradient.
Tracking dye (bromophenol blue) allows IEF progress to be monitored at the beginning of the protocol. If the tracking dye does not migrate toward the anode, no current is flowing. As isoelectric focusing proceeds, the bromophenol blue tracking dye migrates toward the anode. Note that the dye front leaves the IPG strip well before focusing is complete, so clearing of the dye is no indication that the sample is focused. If the dye does not migrate, no current is flowing.
Sample Application by Cup Loading:
If the sample was not applied by means of the rehydration solution, it can be applied using the sample cups, immediately prior to isoelectric focusing. When sample cups are used, the sample load limits are lower and more specific. Higher sample volumes and protein amounts can be applied with paper bridges, which are placed between the anodic or cathodic end of the IPG strip and the electrode strip. A large sample volume requires a large paper pad applied at the other side to absorb excess water.
In a typical IEF protocol, voltage is gradually increased to the final desired focusing voltage, which is held for up to several hours. With cup loading, a low initial voltage minimizes sample aggregation and a low initial voltage generally allows the parallel separation of samples with differing salt concentrations.
The main factors determining the required voltage-hours (Vh) are the length of the IPG strips and the pH gradient used. Sample composition, rehydration solution composition, and sample application mode influence the required voltage-hours.
Focusing for substantially longer than recommended will cause horizontal streaking and loss of proteins. This phenomenon is called “over-focusing”. Therefore, focusing time should be reduced to the minimum necessary.
Second-Dimension SDS-PAGE:
After IEF, the second-dimension separation can be performed on various flatbed or vertical systems.
SDS-PAGE consists of four steps:
(1) Preparing the second-dimension gel,
(2) Equilibrating the IPG strip(s) in SDS buffer,
(3) Placing the equilibrated IPG strip on the SDS gel, and
(4) Electrophoresis.
IPG Strip Equilibration:
The equilibration step saturates the IPG strip with the SDS buffer system required for the second- dimension separation. The equilibration solution contains buffer, urea, glycerol, reductant, SDS, and dye. An additional equilibration step replaces the reductant with iodoacetamide. Equilibration is always performed immediately prior to the second-dimension run, never prior to storage of the IPG strips at -40 °C or lower.
Once equilibrated, place the IPG strips using forceps, gel-side down horizontally on vertical SDS-PAGE gel for electrophoresis. Electrophoresis is performed at constant current in two steps. During the initial migration and stacking period, the current is approximately half of the value required for the separation. Stop electrophoresis when the dye front is approximately 1 mm from the bottom of the gel. After electrophoresis, remove gels from their gel cassettes in preparation for staining or blotting.
Visualization of Results:
Most detection methods used for SDS gels can be applied to second-dimension gels.
However, the following features are desired:
i. High sensitive
ii. Wide linear range for quantification
iii. Compatibility with mass spectrometry
iv. Low toxicity and environmentally safe
v. Environmentally friendly.
Because none of the existing techniques can meet all these requirements, a 2-D electrophoresis laboratory may need to have more than one of the following methods in its repertoire.
Autoradiography and fluorography are the most sensitive detection methods (down to 200 fg protein). To employ these techniques, the sample must consist of protein radiolabelled in vivo using either 35S, 14C, 3H or, in the case of phosphoproteins, 32P. For auto-radiographic detection, the gel is simply dried and exposed to X-ray film or—for quicker results and superior dynamic range of quantification—to a storage phosphor screen. Fluorography is a technique that provides extra sensitivity by impregnating the gel in a scintillant such as PPO (2, 4-diphenyloxazole) prior to drying.
Silver staining is the most sensitive non-radioactive method (below 1 ng). Silver staining is a complex, multi-step process utilizing numerous reagents for which quality is critical. It is, therefore, often advantageous to purchase these reagents in the form of a dedicated kit, in which the reagents are quality assured specifically for the silver-staining application. By omitting glutardialdehyde from the sensitizer and formaldehyde from the silver nitrate solution the method becomes compatible with mass spectrometry analysis, however, at the expense of sensitivity.
Coomassie staining, although 50- to 100-fold less sensitive than silver staining, is a relatively simple method and more quantitative than silver staining. Coomassie blue is preferable when relative amounts of protein are to be determined by densitometry. Colloidal staining methods are recommended, because they show the highest sensitivity, down to 100 ng/protein spot.
Negative Zinc—Imidazole staining has a detection limit of approx. 15 ng protein/spot and is well compatible with mass spectrometry, but it is a poor quantification technique. Fluorescent labelling and fluorescent staining with dyes have a sensitivity in-between colloidal Coomassie and Silver Staining.
These techniques require fluorescence scanners, but they are compatible with mass spectrometry and show a wide dynamic range for quantification. Apart from staining, Second-dimension gels can be blotted onto a nitrocellulose or PVDF membrane for immunochemical detection of specific proteins or chemical micro sequencing.
Preserving the Gels:
The gels are optimally stored in sheet protectors after soaking them in 10% v/v glycerol for 30 min. Un-backed gels are shrunk back to their original sizes by soaking them in 30% (v/v) methanol or ethanol/4% glycerol until they match their original sizes. For autoradiography the gels are dried onto strong filter paper with a vacuum drier or in-between two sheets of wet cellophane sealed at ends.
Further Analysis of Protein Spots:
Picking the spots:
Robotic systems are available that automatically picks selected protein spots from stained or de-stained gels using a pick list from the image analysis, and transfers them into micro-plates for further analysis.
Digestion of the proteins:
The gel plugs are automatically digested in the computer controlled Digester; the supernatant peptides are mixed with MALDI matrix material and spotted onto MALDI slides using robotic spotter.
MALDI-ToF mass spectrometry:
In the MALDI-ToF mass spectrometer, a laser beam is fired into the dried peptide-matrix spots for ionization of the peptides. After accurate determination of the peptide masses, databases are searched for identification of the original proteins.
Technique # 10. Microchip Electrophoresis:
The further miniaturization of electrophoretic systems has led to the development of microchip electrophoresis, which has many advantages over conventional electrophoresis methods, allowing very high speed analyses at very low sample sizes. For example, microchip analysis can often be completed in tens of seconds whereas capillary electrophoresis (CE) can take 20 min and conventional gel electrophoresis at least 2 h.
Using new detection systems, such as laser-induced fluorescence, picomole to attomole (10-18 moles) sensitivity can be achieved, which is at least two orders of magnitude greater than for conventional CE. Detection systems for molecules that do not fluoresce include electrochemical detectors, pulsed amperometric detection (PAD), and the sinusoidal voltammetry.
All these detection techniques offer high sensitivity and are ideally suited to micromachining and micro fabrication technologies. Finally, the applied voltage required is only a few volts, and it eliminates the need for the high voltage used by CE.
The manufacturing process that produces microchips is called micro fabrication. The process etches precise and reproducible capillary-like channels (typically, 50 µm wide and 10 µm deep; slightly smaller than a strand of human hair) on the surface of sheets of quartz, glass or plastic. A second sheet is then fused on top of the first sheet, turning the etched channels into closed microfluidic channels.
The end of each channel connects to a reservoir through which fluids are introduced/ removed. Typically, the size of chips can be small as 2 cm2. Basically the microchip provides an electrophoretic system similar to CE but with more flexibility.
Current developments of this technology are based on integrating functions other than just separation into the chip. For example, sample extraction, pre-concentration of samples prior to separation, PCR amplification of DNA samples using infrared-mediated thermo-cycling for rapid on-chip amplification, and the extraction of separated molecules using micro-chamber-bound solid phases are all examples of where further functions have been built into a microchip electrophoresis system. An interface has also been developed for microchip electrophoresis-mass spectrometry (MCE-MS) where drugs have been separated by MCE and then identified by MS.


